
The GBPUSD has indeed pushed above the 200 hour MA (See prior post HERE) and has move up toward the underside of a trend line that has provided both support and resistance (and energy on breaks) over the last 4 days of trading (see chart below).
The level comes in at 1.5722. Above that is the 1.57347-1.57398 area which was a ceiling on November 17, 21 and 25. It has also been in play as a top on November 27 and December 2 (see hourly chart).
Support should now come in against the 100 and 200 hour MAs at 1.5683 and 1.5695. The price should not go below these levels if the buyers are to remain in control. Then again, who is in control for more than a day or two in this pair. So tread lightly and don’t be afraid to take profit off the table. The “market” is doing that against technical levels, so why not you too?
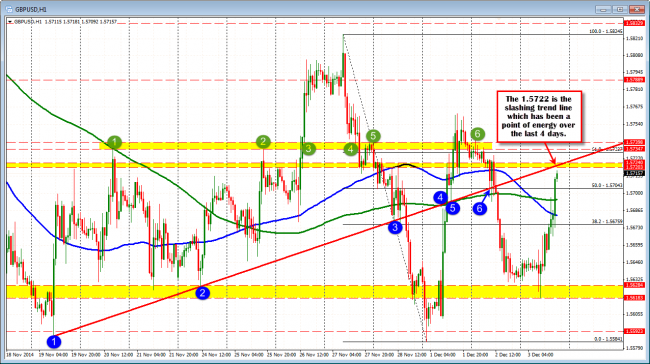
The GBPUSD has resistance at the 1.5722 and above that 1.57347-398

