
The US Employment day can be a volatile one. The fortunes of the market can swing on 50K jobs in a nation with +300 million people. Then there is the question of other things such as what the ECB said yesterday (it seems a huge split is forming – see Adam’s post HERE ). So, be careful. Like yesterday, the swings can be shocking.
From a technical perspective, the price levels are similar to yesterday. Today, however, we are trading right around what was the low levels for all of November (see hourly chart below). That area comes in at the 1.2357-61. Hanging around this level is a bit of a tell that the market may be looking for something stronger and thus make the idea that the Fed will tighten sooner, more likely (see WSJ article HERE). That bias can change in an instant dependent on the number of course.
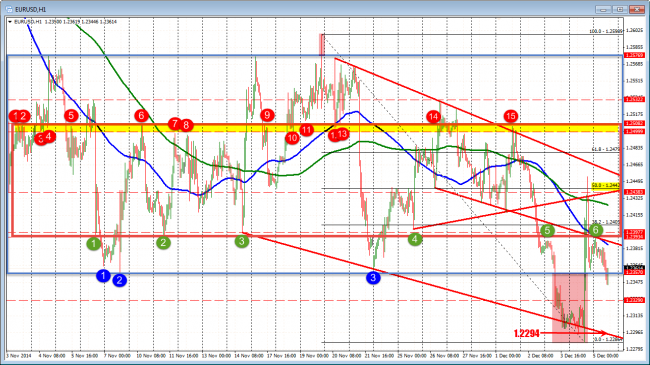
EURUSD hourly chart pre-Employment report
Technical levels to target on the topside today (all from the hourly chart above):
- 1.2386-89 – 100 hour MA/Underside of trend broken trend line. A break above this MA and old trend line (we held under it today) would be step 1 today for a bullish move
- 1.2426: 200 hour MA (green line) . Yesterday, the price stalled near it, then triggered stops above it. It is closer today, so a move above it, should be easier.
- 1.24427: 50% of the move down from November high
- 1.24622: Topside trend line region. A move to this area would be a 116 pips from the low today. The average range over the last 22 days is 101 pips. If the number is a weak surprise,this could be the target area
- 1.24795: 61.8% retracemenet.
- 1.2500-1.2508: This is the topside of the Red Box in the chart that has been a resistance and support area in November. This week, the high stalled against this area.
- A move above the 1.2500-08 will look toward 1.25769 ( not likely today but a focus for next week)
On the downside,
- 1.2329: Low from 2008 The low price after the initial spike higher yesterday came down to 1.2328 area.
- 12286-94: The lows yesterday and on Wednesday went below this line but not for long (at 1.2294). The low from yesterday came in at 1.2286. The range for the day would be around 107 pips if at the low. This is near the 101 pip average range over last 22 days.
- 1.2222: Trend line on the monthly chart
- 1.2131: the 50% of the move up from the post 1999 Euro introduction low.
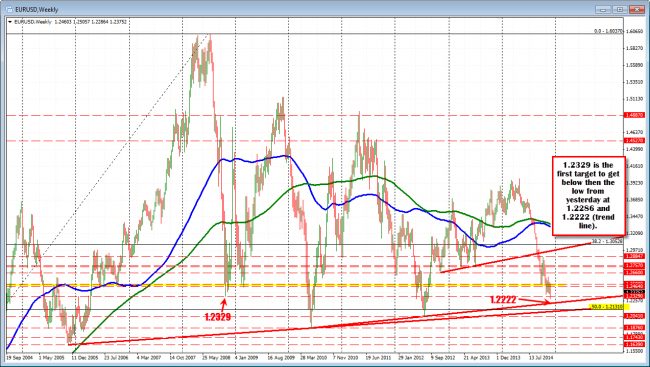
The downside targets come mainly from the longer term chart
Those are the levels that are of interest to me from a technical perspective. Remember, the action can be very volatile so trade cautiously.
PS For the USDJPY see chart below
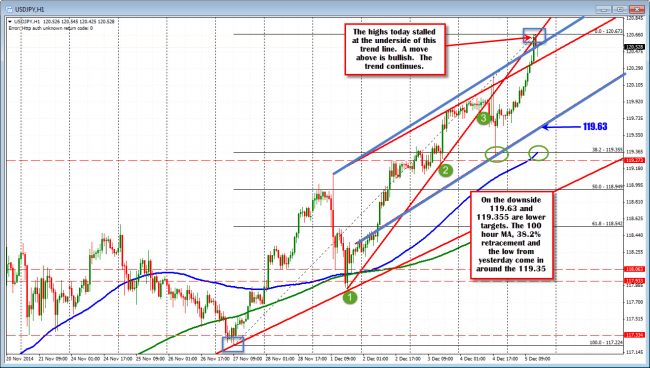
USDJPY pre -employment

