
The GBPAUD has been tracking the 100 bar MA on the 5 minute chart today (see blue line), and if not that MA,then the upward sloping trend line.
Both have been instrumental in keeping the bullish bias. Until the price breaks below both tech levels, the trend continues to the upside.
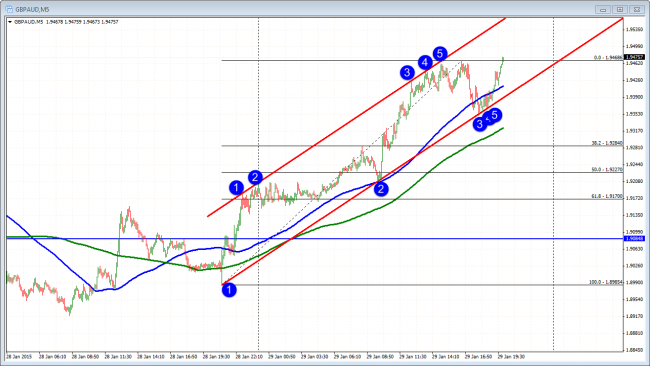
GBPAUD keeps the buyers in control above trend line and 100 bar MA.
Looking at the daily chart below, the low to high trading range today is 318 pips today. The recent high ranges come in at 350 and 373 pips respectively. So although the pair may seem extended, the range can go higher. Also looking at the daily chart the price is above the previous high at the 1.93067 area. Going short is risky.
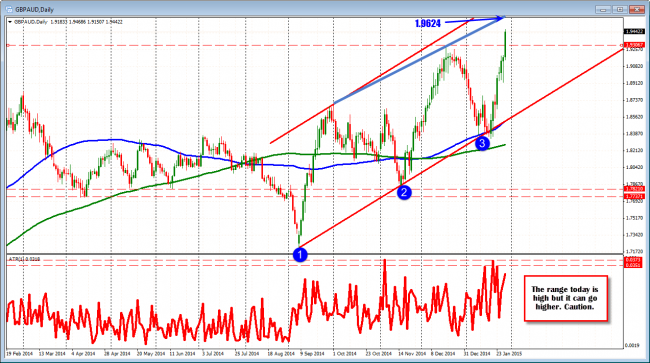
GBPAUD daily chart is breaking higher, has a large range but can go higher.
Helping the trend today is the fall in the AUDUSD. That pair has seen the price break below the 200 month MA (see: earlier post by clicking here) at the 0.7780 level. That key support level did not hold on the first test. So momentum and the trend remains to the downside in that pair.
That makes trying to pick a top in the GBPAUD still a bit premature and also risky. Be patient. The charts are not showing an end of the trend just yet.

