
100/200 hour MA. 50% retracement. 100 bar MA on 4-hour chart all ahead
Earlier the GBPUSD had moved above its 100 day MA but stayed underwraps by a swing area in the 1.3110-25 area (see earlier post).
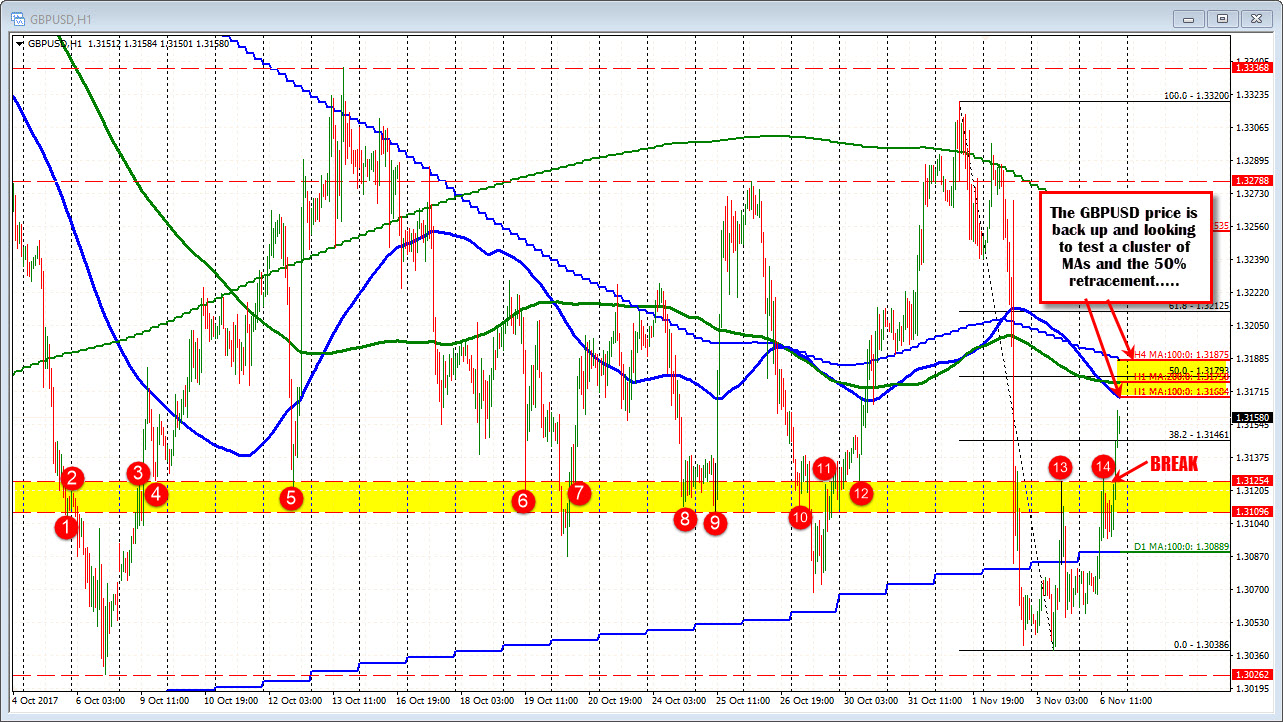
That swing area was broken, and the price raced above the 38.2% level at 1.3146. There is a cluster of MAs ahead that could slow the ascent higher.
Getting in the way on the topside include the:
- 100 hour moving average at 1.31684
- 200 hour moving average at 1.31758
- 100 bar moving average on the four hour chart at 1.31875
- Above the 200 hour moving average and below the 100 bar moving average in the 4-hour chart is a 50% retracement at 1.31793
That's what happens when the price consolidatas.
Looking at the daily chart below, the price since early October, has seen a lot of ups and downs.
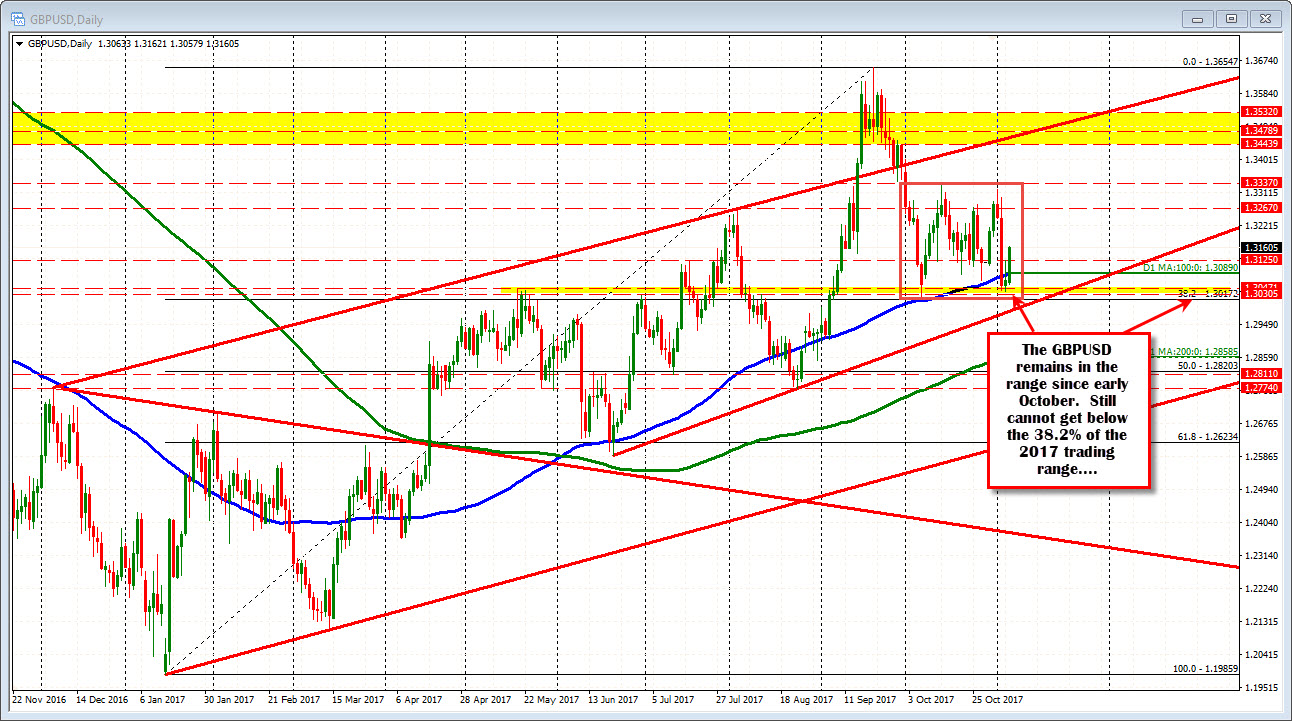
At the lows last week and at the start of today, the pair was below the 100 day MA BUT was not able to break a swing level between 1.30305 and 1.3043, nor reach the 38.2% retracement of the move up from the January 2017 low at 1.30173. The move back above the 100 day MA took the steam out of the shorts, and we remain in the trading range since early October.

