The 100/200 day MA stalled the rally on Wednesday.
On Tuesday, I took a look at the USDMXN with a look back to 2016 at election time. Four years ago, the stakes were much higher as Trump ran on building a wall and throwing out the NAFTA agreement. Of course, Mexico did not build a wall, but the US did build parts of a wall. Also NAFTA was replaced by the USMCA agreement.
Nevertheless, a Trump victory would hurt the MXN (he is just a hibernating bear). A Biden victory would conversely be more positive for the MXN (weaker USDMXN), even if it is only the relief that bear has left the neighborhood.

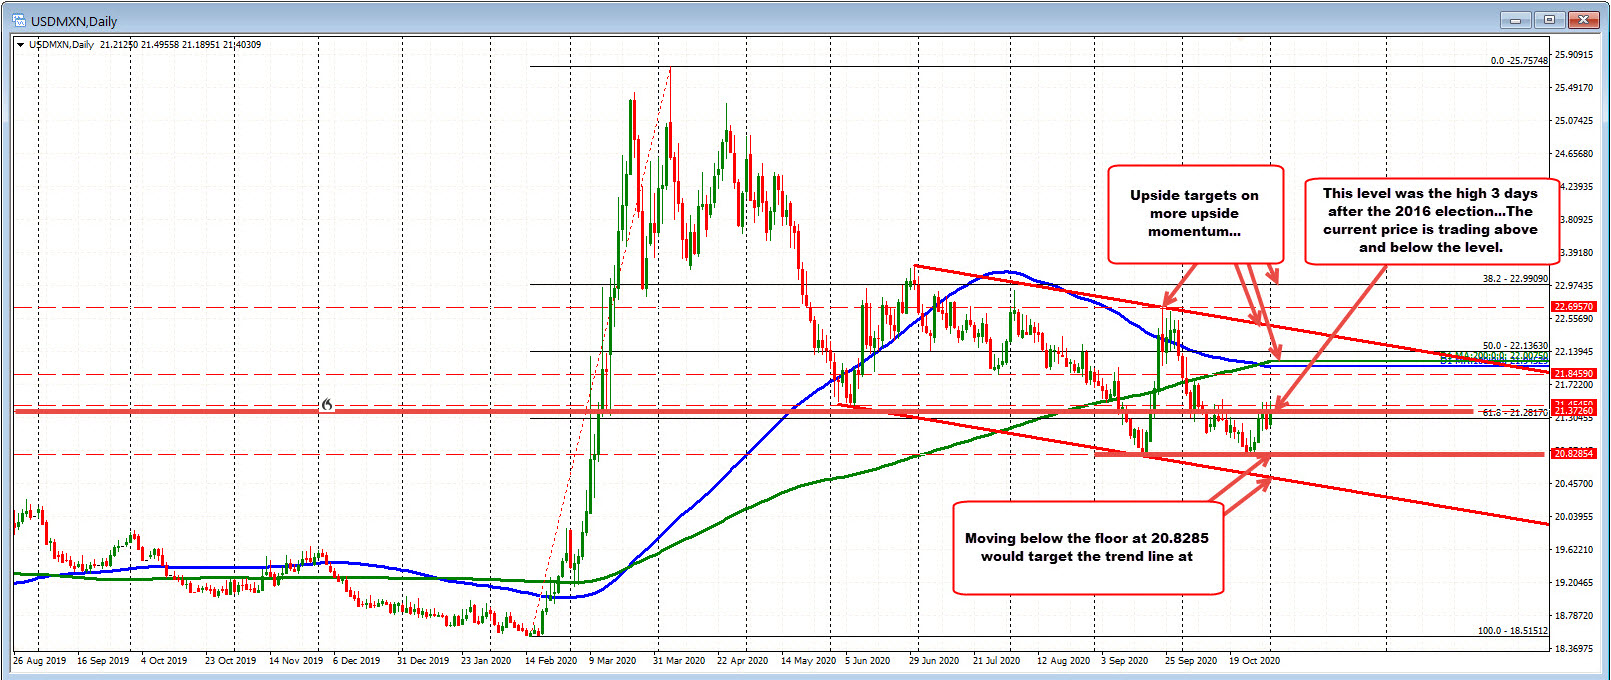
Also the post, a move to the upside would target the 100 and 200 day moving averages (blue and green lines in the chart above) as the 1st major targets (see post here).
So what happened?
On Wednesday, the initial results were more favorable for Pres. Trump in certain swing states. That helped to push the price of the USDMXN higher. The move to the upside reached the 100 day moving average (blue line at 21.9181) with the high price reaching 21.9745, but fell short of the 200 day MA (green line at 22.0300).
The subsequent fall took the price down with a new low for the week, month, and going back to March of 20.5301. At the low, the price stalled at a lower trend line at 20.5310, and bounced. The current price is at 20.6135.
Both the MA above and the trend line were outlined in the post on Tuesday (here is the chart from that post outlining the key technical levels in play).
What now?
ON the way to the lower trend line, the price fell below a swing floor at 20.8285 area. That level is close topside resistance now. Stay below keeps the bears firmly in control. On the downside, the lower trend line will continue to be the key downside target to get to and through. Do so, and the sellers take more control, and there should be more downside probing.