
Forex new for traders on July 27, 2017
- US stocks mixed but off lows at the close
- Citi raises US Q2 growth to 2.9% from 2.5%
- US crude oil futures settle at $49.04/BBL
- Republican leaders say VAT and border-adjustment tax ideas are dead
- As Nasdaq tumbles, the JPY crosses are also tumbling
- The simple model for how market volatility works in 2017
- Here is a big reason why the Canadian dollar is struggling today
- Mnuchin says tough talk won' t work against FX manipulators
- US sells 7-year notes at 2.126% vs 2.125% WI bid
- Amazon' s Jeff Bezos is the world's richest man
- Final 2Q Atlanta Fed GDPNow estimate 2.8% vs. 2.5% last
- Treasury secretary Mnuchin: Volker rule problem is complexity/regulatory overlap
- US Fed nominee Quarles. Actions of Fed should be predictable
- EIA natural gas storage comes in at 17 BCF vs 24 BCF estimate
- David Ramsden will join Bank of England MPC. He might be a dove
- JPMorgan raises US Q2 GDP forecast to 3.5% from 3.0% (update: Others too)
- Japanese opposition leader Renho quits in sign of continued global political fragmentation
- Trump decides it's no-holds bar with his own Senators. Something Ray Dalio warned about
- Chicago Fed (June) national activity index 0.13 vs 0.35 est
- June US durable goods orders +6.5% vs +3.7% expected
- Initial jobless claims for (July 22 week) 244k vs 240K est
- US June wholesale inventories mm flash +0.6% vs +0.3% exp
- US June advance goods trade balance -$63.9B vs -$65.9B expected
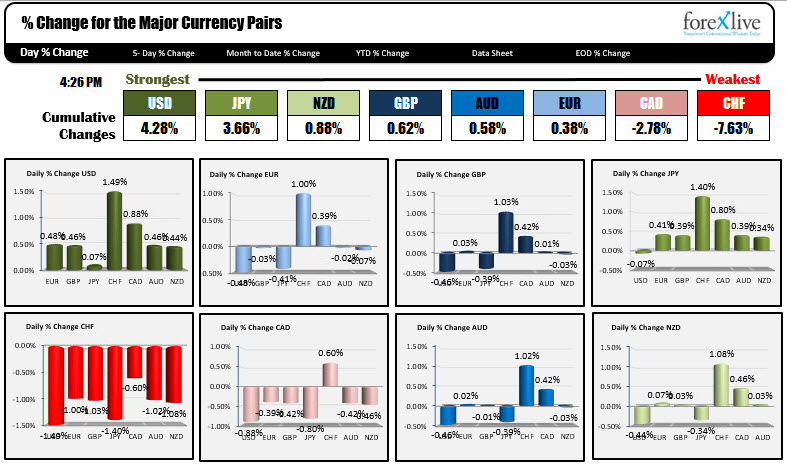
- The strongest and weakest currencies as NA traders enter for the day
In other markets, a snapshot at the end of day shows:
- US stocks ending mixed but off the lows. Nasdaq was down over -100 points at the lows but closed down -40. S&P down -2.41 points or -0.10%. Dow up 85 points or +0.39%
- US debt yields are higher: 2 year 1.361%, up 0.6 bp. 5 year 1.852%, up 2. 3 bp. 10 year 2.3157%, up 2.8 bp. 30 year 2.929%, up 3.8 bp
- Spot gold is down -$1.08 or -0.09% to $1259.47.
- WTi crude oil +$0.41 or +0.84% to $49.15
There was a slew of data out of the US today. US durable goods, on the back of aircraft orders, rose by a greater thane expected 6.5% (vs +3.7% est). Wholesale inventories advanced by a greater than expected +0.6% vs 0.3% estimate. Initial jobless claims were about as expected at 244K (that equaled the 4-week average). The advanced trade balance came in with a smaller deficit (that is good for GDP). It wasn' t by much, but it was lower deficit.
All of that data, helped lead to a stronger dollar as estimates for 2Q GDP were raised.
- JPMorgan bumped up its forecast to 3.5% from 3.0%.
- Goldman Sachs also raised its estimate to 2.2% from 1.9%
- Barclays to 2.7% from 2.4%.
- The Atlanta Fed GDPNow final estimate settled at 2.8% vs 2.5% last week.
Later, the markets focus turned to stock market - more specifically the Nasdaq composite index which started to decline at a fast pace. At the lows the index was down -100 points (it recovered to -40 by the close). There was no specific reason per se. Earnings have been great, highlighted by Facebook's $1.32 vs $1.13 estimate the night before. However, the Nasdaq did get to up 19.37% for the year at the close yesterday. So if you want an excuse for the decline today, it is just that. 19.37% is a big number.
The fall in the stocks, started the Pavlovian reaction to sell every pair that had JPY as the counter currency in the pair (which is all of them). That included the CHFJPY (down -1.40%), CADJPY (down -0.80%), the EURJPY (down -0.41%), GBPJPY (-0.39%), AUDJPY (down -0.39%), and NZDJPY (-0.34%). The one JPY pair that did not fall on the day was the USDJPY. It gave up much of its gains on the back of the stronger dollar, but it is ending the day little changed. BTW Japan will release their own slew of data in the new trading day including Household spending, CPI, Unemployment, retail sales and the BOJ summary of opinions. Focus will shift to their domestic economy, at least for a little bit.
Below are the % changes of the major currencies vs each other today.
What are some of the technical's saying for the major currency pairs?
EURUSD
The EURUSD moved above the 1.1711 yesterday before the close and in the new day above the 38.2% of the move down from the 2014 high at 1.1735. The high extended to 1.1776, but then started to give up the gains. NY entered with the price back below the 1.1711 level. When the NY high found sellers at 1.1706 - ahead of the key 1.1711 level - all it took was a little nudge and sellers were taking the price below the 100 hour MA (at 1.1667) and to a low of 1.1649. We are ending higher back above the 100 hour MA at 1.1675, but you can argue that technical damage was done on the failures above the 1.1711 (Aug 2015 and Tuesday high) and 1.1735 (38.2%) levels. For traders, watch the 100 hour MA. The price went below it yesterday and bounced. It went below it today and bounced. It went below it on July 20th and bounced. If it stays above it, we will be retesting 1.1711 and maybe even the 1.1735 level (then who knows after that). If it gives way to the downside, a rotation down to the 1.1615 level (2016 swing high), may be in order before the end of the trading week.
USDJPY
Up and down price action today, with the price closing near the prior day close. On the move to the highs today, the price took out the 100 hour MA (at 111.33), the 100 day MA (at 111.52 currently), but stalled at the 200 hour MA (currently at 111.66), before heading lower with the stock tumble. All those MAs were taken out on the way lower. Into the close, the price stalled at the 100 hour MA at 111.33. The price currently trades at 111.26. If the selling is to continue, staying below the 100 hour MA is the most bearish. If the price moves back above the 100 hour MA, the waters get more muddy as traders hopscotch to the next MA level above (i.e., the 100 day MA and then 200 hour MA), or fails to extend and rotates back below the broken level. Right now though, sellers are in control below all those MAs with the lows for the week at 110.84, 110.77 and 110.617 as the next targets.
USDCAD
Are you looking to sell the USDCAD? Well that pair was finally able to extend above it's 100 hour MA (at 1.2504 currently) and move to the 200 hour MA at 1.25605. The high did extend to 1.2575 on stops above the MA level, but quickly reversed back below by the close. We are trading at 1.2552 (the 200 hour MA is at 1.25605). If you looking to sell this would be the area as risk is defined and limited by they 200 hour MA. On the hourly chart, the price has not closed above that MA since June 27th (a month ago). For longs, you want to see that 200 hour MA broken and remain broken. The 1.2560 level is a barometer for bullish above and bearish below as we head into the new trading day.
USDCHF
The CHF was the weakest currency today and the USDCHF was the biggest mover as well. The pair moved above prior swing lows at 0.9612 to 0.9639 and that area (between those levels) is now support in the new trading day. Topside trend lines at 0.9663 and 0.9685 and the July high at 0.9700 are upside targets if the aforementioned support levels hold.

