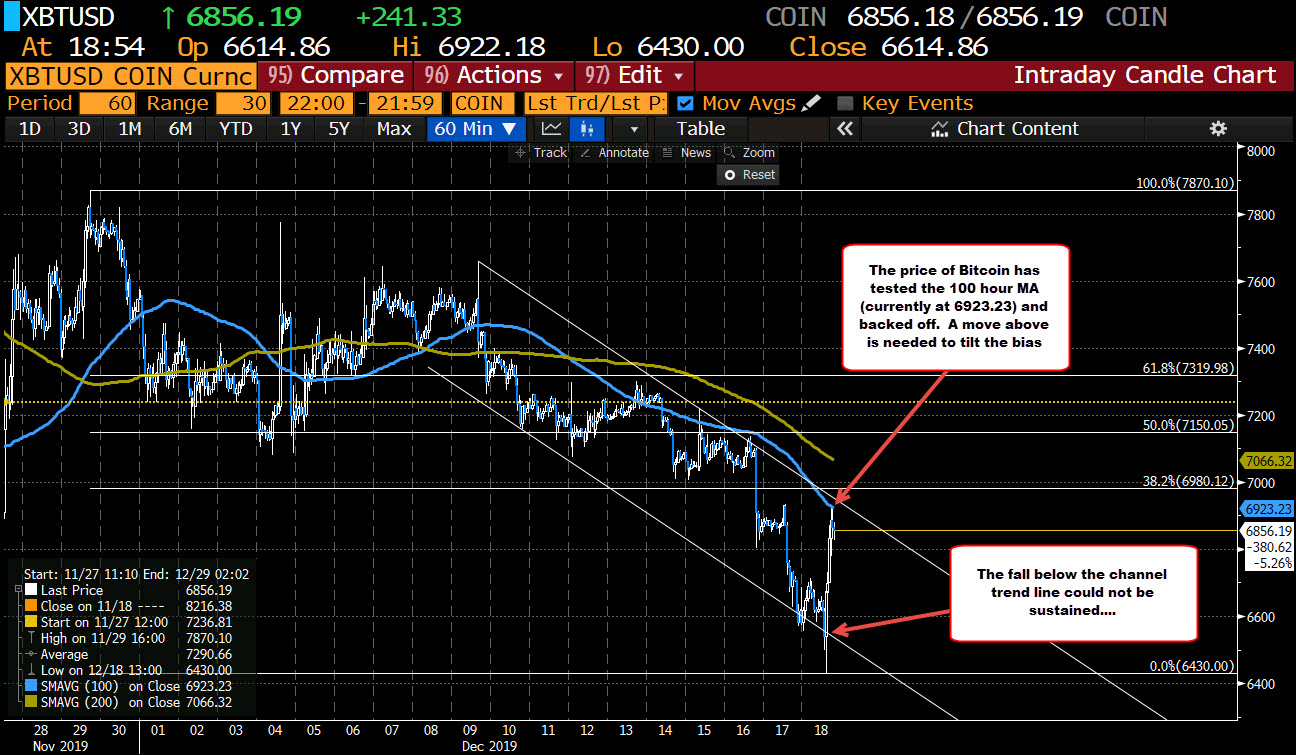
The 100 hour MA stalls the rally. Sellers lean on the test.
The price of bitcoin fell below a lower trend line and in the process moved to the lowest level since May 11, 2019. The low from November at $6526 was taken out in the process. The low for the day reached $6430 (see the daily chart below)

Drilling to the hourly chart, a lower channel trendline was also broken on the move lower, but that break could not be sustained. The sellers turned buyers.
The run higher has now taken the price up to a high price of $6922.18. We currently trade at $6856.19. At the high, the price tested its 100 hour moving average. That moving average comes in at $6923.23. The high stalled just before that level.
The price has consolidated over the last hour so below that 100 hour moving average. It will take a move above to solicit more buying, but for now as long as the price can stay below, I would keep the bias in favor of the sellers at this level. Risk can be defined, risk be limited.