

What is the RSI and how does it work
A quick search about Forex indicator will yield millions of results - 11.2 million results in fact. So once you've cut your teeth trading and you're ready to graduate to a more technical way where do you start?
One of the most popular methods of technical analysis - and likely one of the simplest is (in a broad sense) is trend following. There are various indicators that fit within the "trend following" - S&R (Support and Resistance), SMA (simple moving average), the trademarked and widely hyped Bollinger Bands and RSI (Relative Strength Index).
What is the RSI?
The Relative Strength Indicator plots both the speed and change of price movements and oscillates between 0 and 100. The overbought region is considered to be over 70 - like GBP/USD at the time of writing this article:
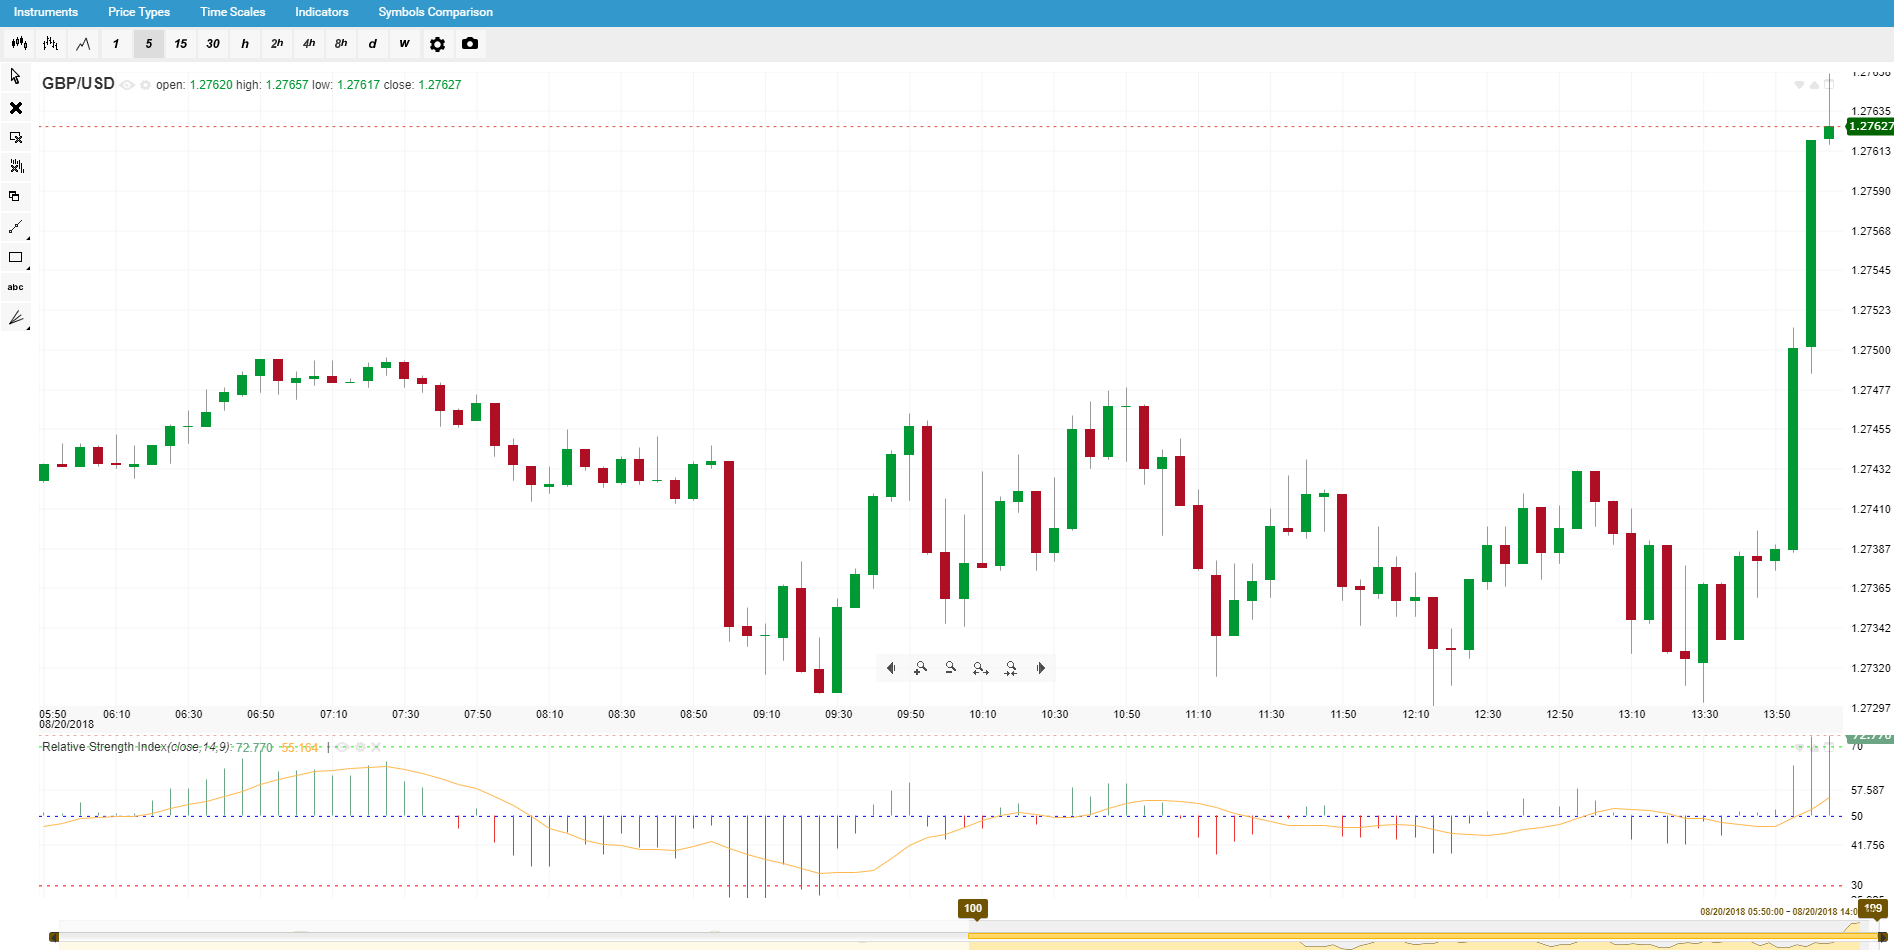
And the asset is in the oversold region when it dips below 30.
What does that mean?
When an instrument's (a synonym for asset) price crosses the 70 or 30 mark of the RSI, then a reversal in its trend is highly likely. So, the way technical traders use RSI, is they enter a position when the price dips below 30 and exit when it crosses 70.
The Bear, the Bull and the S&R
During bull markets you can see RSI banded between 40 and 90 with support ranging between 40 and 50. In a completely inverse scenario, when the instrument is in a downtrend it becomes banded between 10-60 with the range of 50-60 serving as resistance.
Support - Usually during a downtrend the price will bounce off the support level several times, sometimes even reversing into an uptrend. This is usually due to an increase of demand which bolsters the price at the aforementioned level.
Resistance - The inverse of support, when the price is in an uptrend, sell-offs cause the price to reach a level and "correct" back to a price that isn't considered overbought.
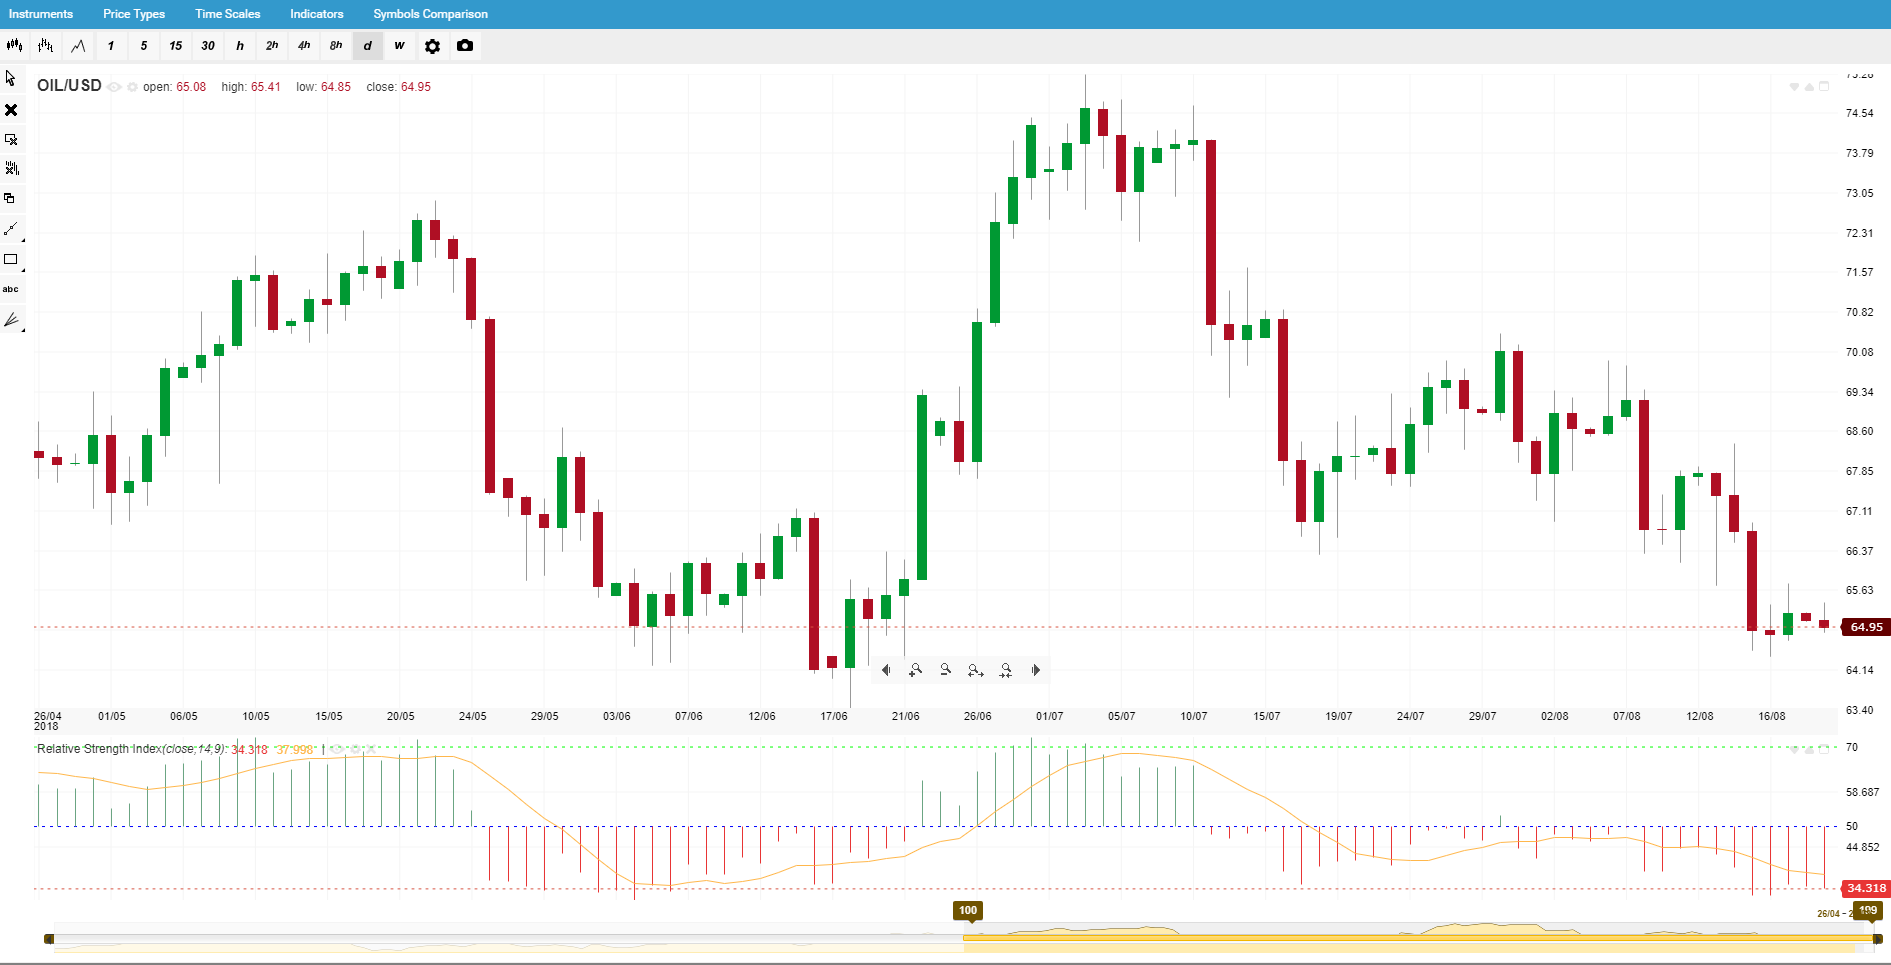
Support seen at the current price of WTI Oil
(at the time of writing this article)
How RSI is Used
As with any indicator, traders are looking for "Buy" and "Sell" signals. These signals basically inform the trader when it would be a good level to open a position and when it's the ideal level to exit a position (or close it).
Most experienced traders use a combination of indicators to cross reference their signals, lowering their risk to 'false signals'.
Partnering with the right broker that has trading conditions and transparent pricing is beneficial regardless of your trading strategy. Some brokers even offer a exclusive risk management tools that allow you to cancel trades for a period of 60 minutes for a small fee.
This article was submitted by easyMarkets

