
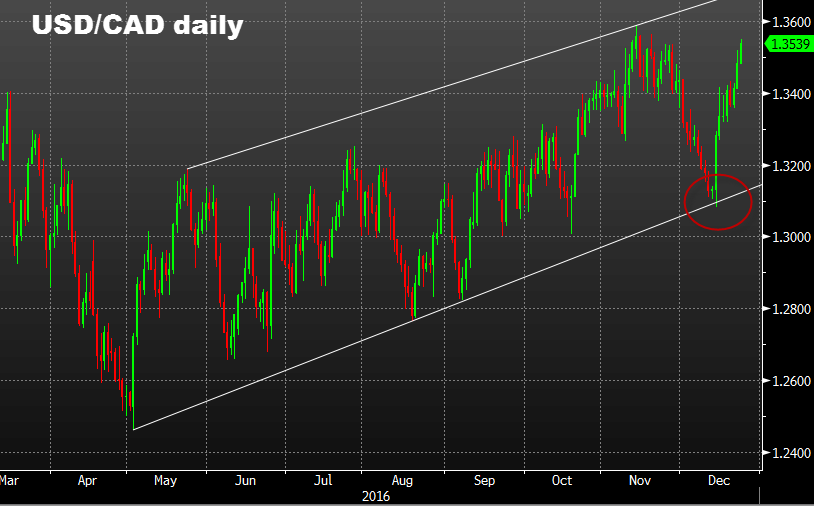
USD/CAD has raced away from support
USD/CAD has climbed for the eighth day in the past nine and the chart is an illustration of the power and pitfalls of technical analysis.

At the start of the run, it didn't look like it would happen. The pair had been in freefall as oil rallied on the heels of the OPEC decision.
On Dec 14 the pair touched 1.3082 and appeared to be breaking below the bottom of the channel and the well-defined trendline that began in May.
But there were three lessons from the action that day:
1) Watch the close
Intraday breakouts don't always last on the daily chart. USD/CAD traded below a key spot but it was rejected within the day and finished much higher.
2) Know the calendar
That chart is why technical analysis works best with at least a little bit of fundamentals. Dec 14 was the date of the Federal Reserve decision and the US dollar shot higher late in the day on the headlines, dot plot and Yellen's press conference.
3) Draw trendlines with a thick pencil
The bottom of the channel 'broke' but only by the thinnest of margins. When you're drawing lines (or setting stops), keep in mind that a few pips below doesn't necessarily mean a break.

