
A closer look at gold

Gold prices have been on the watchlist of almost all investors during the past couple of weeks due to their tremendous rally. The bullion started the year with a sharp spike higher reaching a high of almost $1959 on the 6th of January. However, the precious metal failed to secure gains, and faltered to $1677, weighed down by a series of economic developments, which urged investors to abandon the safe haven. After falling more than 11% in the red territory, since the beginning of April, the price of a gold ounce has rallied by more than 13% to reach the green territory again for the year, trading around $1900 at the moment of writing the report.
What were the reasons behind these fluctuations in gold prices? And where could prices be heading next?
After covid19 disrupted the economic activity and knocked stock markets in the first quarter of 2020, investors sought gold's safety as a store of value. Central banks and governments jumped in with all their weaponry to support their failing economies, pumping a humongous amount of money into the markets. We learned in economics 101, that as the supply of an item increases with demand being constant, its price will go down. Thus, holding cash could be among the worst investment to do. To secure their purchasing power, investors favored gold, which is usually a good hub in times of high market risks and uncertainty.
Due to the massive stimulus plans whether fiscal or monetary, equity markets had an impressive rally, where most of the world's top economies stock indices recovered all losses, and continued moving north to record high. This improvement in risk sentiment drove funds out of safety investments, and one of those safe havens was gold.
As Pfizer, Moderna, and the likes introduced their vaccines, investors started focusing on the light at the end of the tunnel. Therefore, central banks and governments which were aggressive with their economic aids will have to start thinking of unwinding these measures and get closer to normalization to avoid overheating.
When we are talking about the Federal Reserve unwinding its stimulus measures, we expect the Fed to start tapering its asset purchases program of $120 billion a month, and in the future, return the Fed Funds Rate to higher levels. Therefore, the bond market started pricing this action, and US Treasury yields moved higher as investors dumped bonds. A bond price and its yield move in the opposite direction. So as the price of a bond goes higher, the yield goes lower and vice-versa.
Inflation
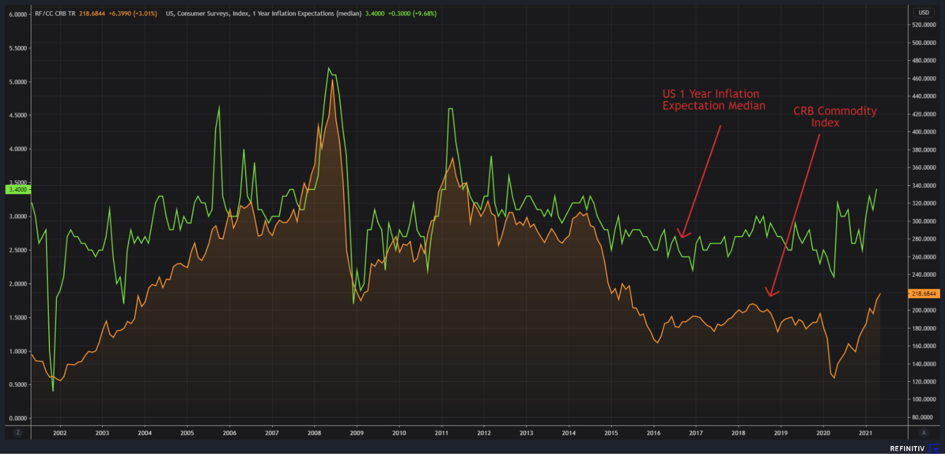
The covid19 pandemic disrupted supply chains, leading to less supply mainly for commodities. Meanwhile, the excess amounts of money that were pumped into the economy especially in the United States, and the high saving rate of families, triggered strong demand for goods and services. If you were stuck at home for a long period, you are getting your financial aid, and you are not spending much, but you are saving a decent amount of money. When the conditions start to go back to normal, you will spend most if not all of the saved money. Thus, creating demand pressure with tight supply due to disrupted supply chains, prices went higher. The CRB Commodity Index gained more than 58% in the past 52 weeks to top 221, the highest since July 2015. In the chart below, you can see how Inflation expectations and the Commodity index are approximately similar in their movements. Higher prices of commodities push inflation expectations higher, and fears of higher inflation would force investors to hedge with commodities.

Why are we looking at inflation expectations? Because they are the hottest topic at the moment, and if you are an investor, you would be looking for the real interest rates or real yields when assessing your returns from a particular investment. So basically, the equation of real yield is as follow:
Real Interest Rate = Nominal Interest Rate - Inflation Rate
So, if inflation moves higher with nominal interest rates remaining steady, the real interest rate will decrease furthermore. Therefore, investors would go after investments where their returns minus inflation would be positive.
At the moment, the Federal Reserve is not willing to taper asset purchases, which if happened would drive the US Yields higher, leading to higher real interest rates. Fed officials are assuming that the current rise in inflation is transitory, because of numerous factors that erupted from the stimulus used to recover from Covid19. The board believes as fiscal stimulus impact fades away, and supply chains go back to somehow normal activity, the current price pressures will ease significantly, with the help of technology and other demographic factors that are deflationary in the long run. However, as we see significant improvement in the Labor market (similar to the March report), better growth figures, the Federal Open Market Committee could start discussing normalization plans. But, with the labor market still far away from pre-pandemic levels, the Fed will not risk damaging the economic recovery, to tackle inflation, unless inflation materializes.
The chart below shows how gold prices (Green) move higher as the 10-year TIPS yields (Blue) move further into the negative territory. (When the blue curve rises, yields are going further into the negative territory)

Therefore, the equation is very simple, as the Federal Reserve raises its beliefs in tightening the monetary policy by cutting asset purchases and later on raising interest rates, gold prices will fall under pressure, and vice-versa.
A quick look at how Central Banks and Exchange Traded Funds (ETFs) are positioning
During the first quarter, the purchases of Central banks rose above 100 tons, as they looked into diversifying their reserves and favoring holding gold to fiat currencies. Hungary was among the top buyer, adding 63 tons to its official reserves, while the Philippines dumped around 24.8 tons.

The chart below shows the central bank's net cumulative purchases since 2018. It is clear how purchases picked up to March as prices were going down from their tops.

Another look at how the Exchange-traded funds are behaving. The chart shows that during this rally the total ETFs lagged the rally, unlike what happened in 2020 when prices rallied to their all-time high of $2072. Also, the largest trust, the SPDR Gold trust is lagging the likes. Yesterday, the SPDR Gold Trust dumped around 131000 ounces to a total holding of 33,568,314, while the Chinese YiFangDa Gold ETF physical holding grew by 1,374,434 million ounces to 4,508,119 the highest since late March. The total ETF physical gold holding is currently residing at 75,294,035 ounces.

What are the big players forecasts?
With gold prices currently trading around $1900, they are well above the estimates of big banks. The median of those forecasts is between $1743 and $1784 till the end of 2022.

Technical Analysis
The Bullish Scenario
Gold prices had a significant rally since early April, rising by more than 13% to their highest levels since January. A positive scenario would support a slight correction towards the 21-day Exponential moving average which is currently sitting at $1851, to prepare for an impulsive move towards this year's high of $1960, and an extended target of the all-time high of $2072.

The Bearish Scenario
A clear rejection took place earlier this week from the $1912 area, a total failure, and possible change in trend would take place by violating the uptrend line and the 21-day exponential moving average near $1845, and a bigger drop towards the 200-day exponential moving average which is currently at $1802.

This article was submitted by Wael Makarem - Market Analyst at ICM.com

