Watch for pull back to the 200 day MA
The EURCAD is making a break for it.
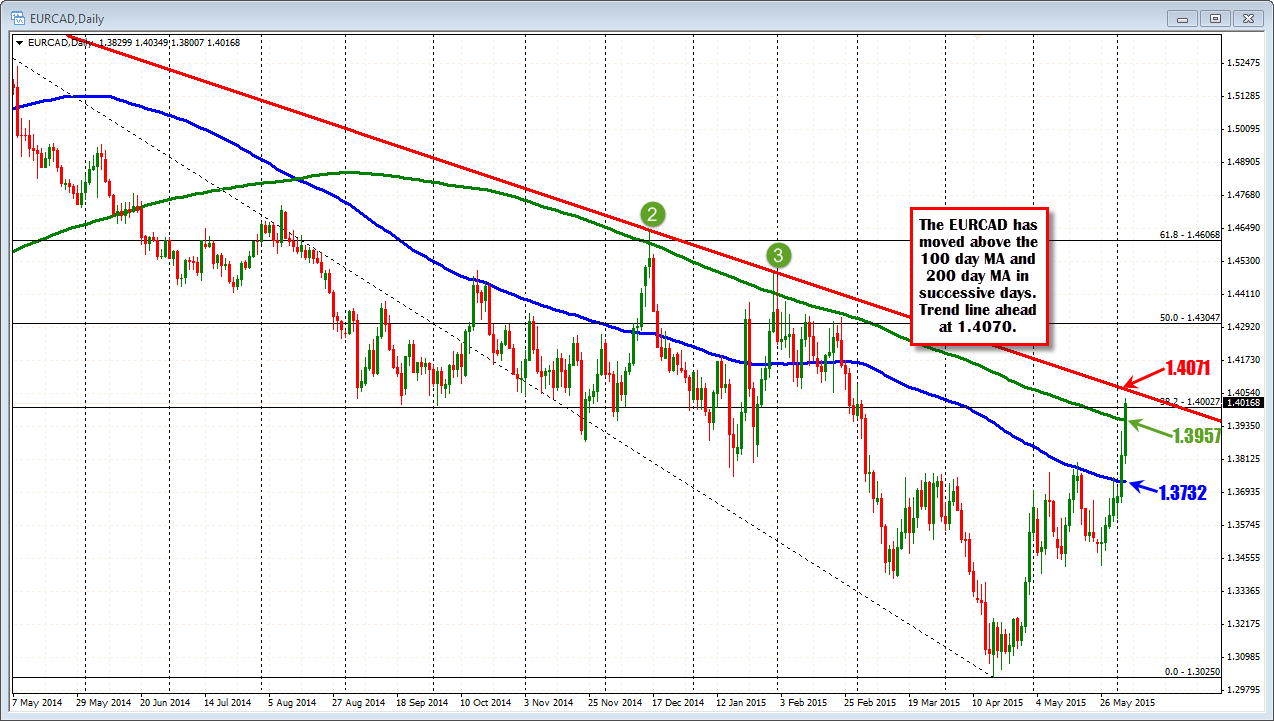
The pair over the last few days, has pushed above the 100 day MA (blue line in the chart below at 1.3732) yesterday and has followed up with a break above the 200 day moving average (green line in the chart below) and the 38.2% retracement at 1.3957 and 1.40027, respectively. A trend line cuts across at the 1.4070 level and would be the next target.

With resistance looming ahead, it might be best to see if there is a correction back toward the 200 day MA at the 1.3957 level. Holding that level on a correction would be a nice entry level for a test (and move above?) of the trend line above. A move back below the 200 day MA (with momentum) would not be welcomed.
The price has not closed above the 200 day MA since back in June of 2014. There were three other looks at life above the 200 day MA in Nov and Jana and Feb 2015, but each failed to close above the key MA level. Today would be a milestone (longs can stay long) if the price can close above the key MA level.


