
This is a look back over the past 12 months for the daily mid rate setting for onshore yuan.
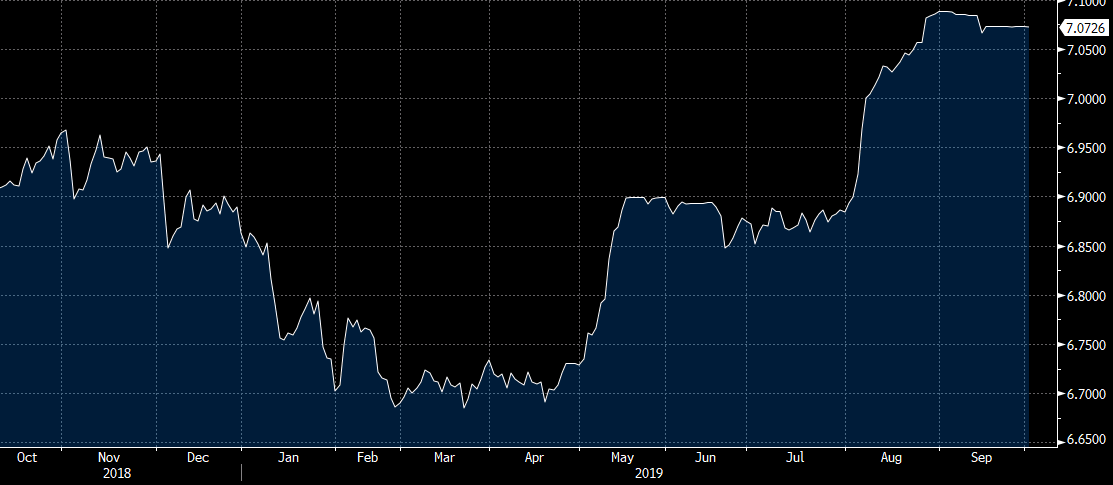
Folks do argue about whether China is manipulating its currency and may well point to such price moves of a weakening CNY (against the USD in the above chart).
I guess if you look at a longer term chart different folks might make different arguments, this going back a lot longer:
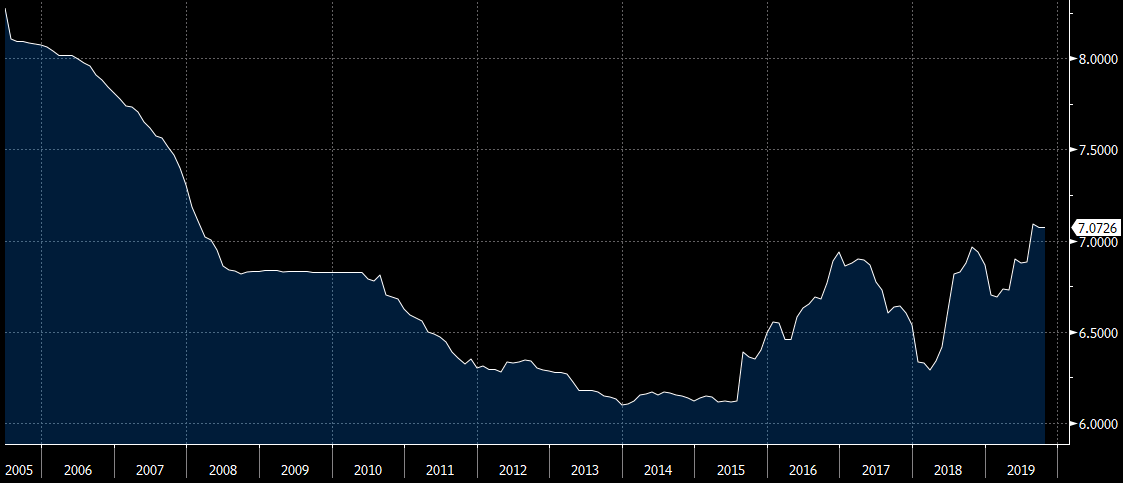
Cherry pick the time frame you prefer.

