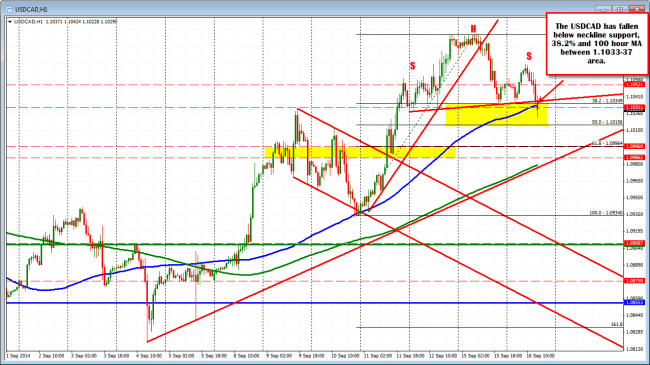
Technical levels broken in the USDCAD after better Canada Manufacturing Sales data
The better Manufacturing Sales data (+2.5% vs +1.1% estimate and a higher revision to last month’s data) has helped to push the USDCAD below the support levels.

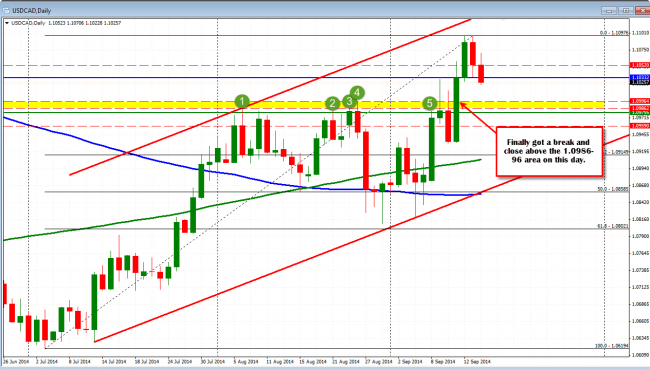
Looking at the hourly chart above, the price has fallen below head and shoulder neckline support, the 38.2% retracement and the 100 hour moving average (blue line) at the 1.1033-1.1037 area. Stay below, and the bears remain in control and should be able to push toward the 1.10156 (50% retracement of the last leg up) and then 1.0986-96. The 1.0986-96 was a ceiling in the month of August (see daily chart below). A move below that level would discredit the break higher seen just last week. Look for buyers against the area on the first test.

The USDCAD had a ceiling at the 1.0986-96 area in August.


