
Highlights of the July 2021 US CPI report
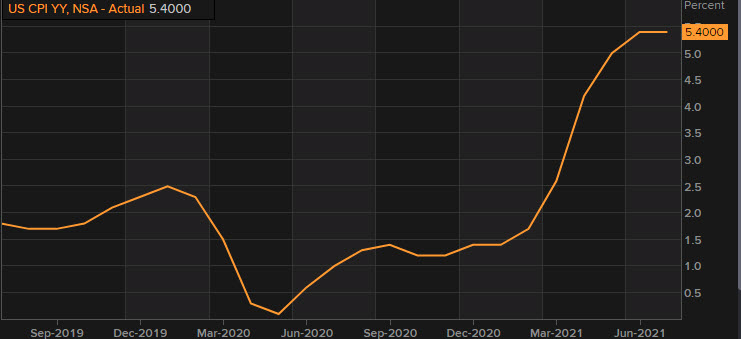
- Prior (+5.4%) was highest since 2008
- Ex food and energy +4.3% vs +4.3% y/y expected
- Prior ex food and energy +4.5%
- CPI m/m +0.5% vs +0.5% expected
- Prior m/m reading was +0.9%
- Core m/m +0.3% vs +0.9% exp -- lowest in four months
- Full report
Wage data:
- Real avg weekly earnings -0.1% m/m vs -0.9% m/m prior(revised to -0.5%)
Some higher numbers were certainly feared as the US dollar has slumped across the board on the report. It's down 20 pips on every front in a flash.
In the bond market, US 10s are down to 1.347% from 1.370%.
I think this is combining with the comments from Barkin and Evans to push back the taper timeline to Nov/Dec and ensure it will be a slow process rather than the quick taper than Bullard has been talking about.
If inflation falls back down to target without the Fed hiking rates, why would they need to hike rates?
In terms of details, the index for cars rose another 0.2% but that was much smaller than recent months and suggests that the big rollover isn't too far away. Used vehicles rose 0.2% after three consecutive months of at least 7.3% m/m. Motor vehicle insurance fell in the month and so did airfares.
Food inflation is set to be a talking point in the next few months. It rose to 3.4% y/y from 2.4% prior but shelter up 0.4% m/m accounted for half of core inflation and is the main area to watch, particularly once eviction moratoriums end in Oct. However within that component, rents rose just 0.2% and 1.9% y/y, with the other half of the rise due to a 6.8% rise in hotel rates. Owners-equivalent rent is at 2.4% y/y.
It's clear the market is looking through energy inflation in particular with gasoline prices up 41.8% y/y and natural gas up 19%. If energy prices stabiliize here those will be contributing 0% a year from now (or sooner in the case of gasoline).
Here are some nice charts from BofA on the monthly and yearly moves.


