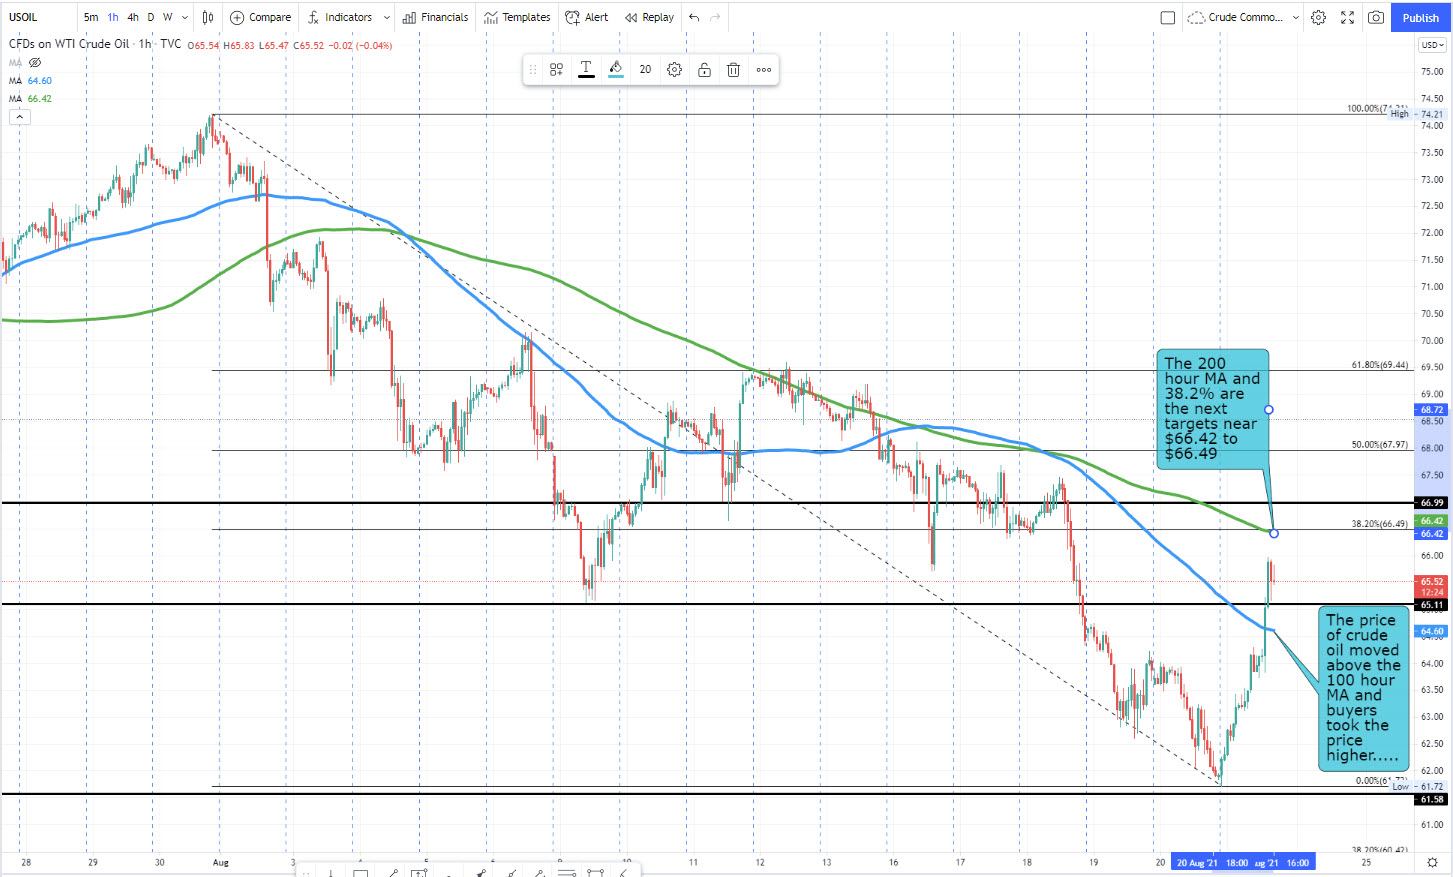
100 hour moving average at $64.60. 200 hour moving average at $66.42
The price crude oil fell for seven consecutive days and during that time the price tumbled by over 11%.
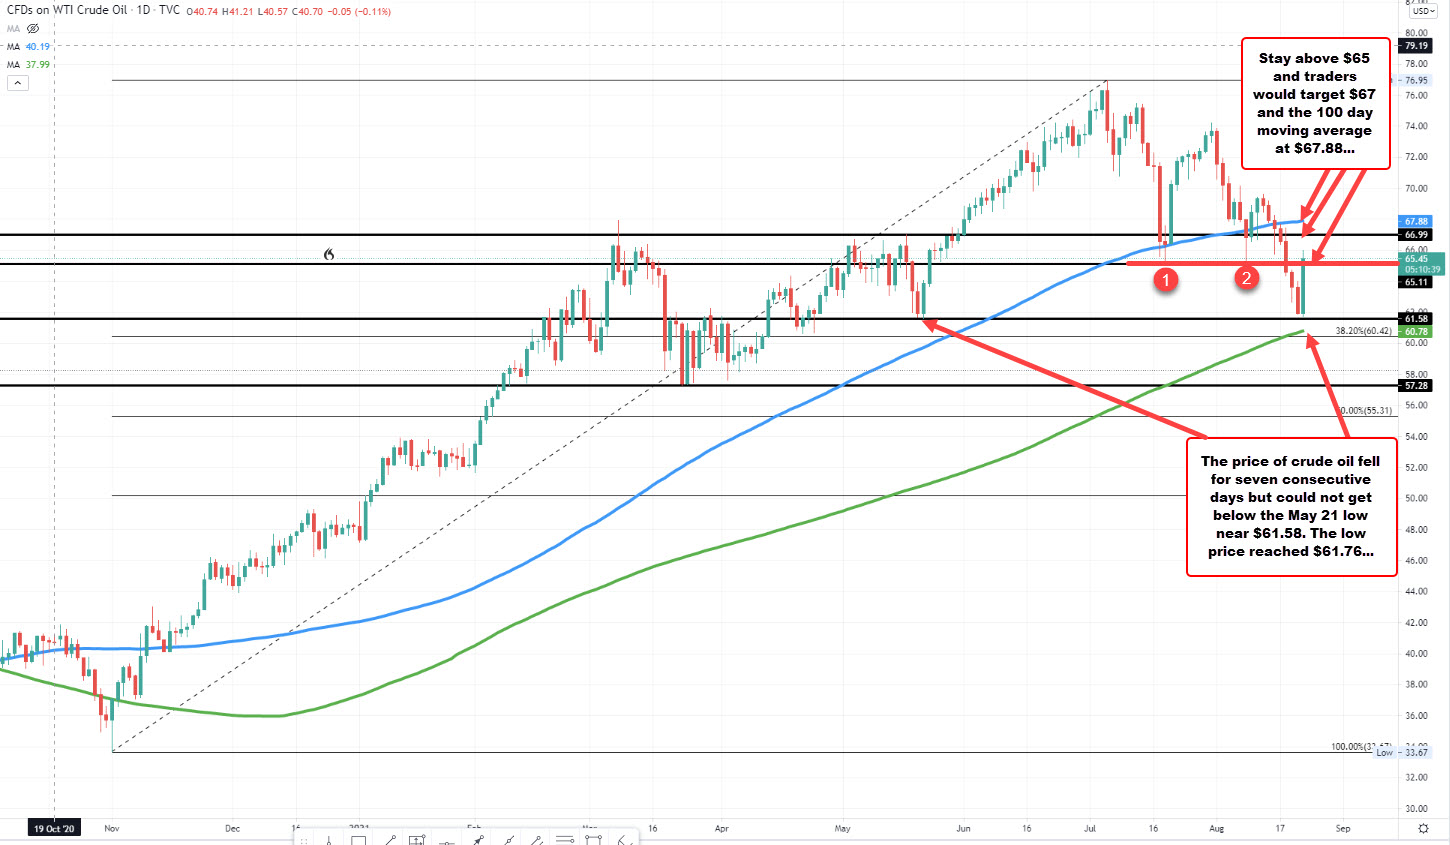
Looking at the daily chart, the 7 day decline saw the price moved below its 100 day moving average at $67.88 currently (blue line in the chart above). The fall took the price to a low today of $61.76. That low stalled just ahead of the May 21 low at $61.58. The inability to break that level technically, gave traders a reason the buy. Adam pointed out other fundamental reasons in his earlier post (CLICK HERE).
What now?
Staying on the daily chart, the price has moved above the double bottom's near $65.11 to $65.17 (lows from July and early August - see red numbered circles). The high reached $65.97. If the price can stay above the $65.11 area (down $65), it would keep the buyers in play with the next target at $67 and above that the 100 day moving average at $67.88
Drilling to the hourly chart below, the price earlier today rose above its 100 hour moving average at $64.60. On a break of the $65 level, that would be the next target on further selling.
On the topside, further upside momentum would target the 200 hour moving average and 38.2% retracement of the move down from the end of July high at $66.42 and $66.49 respectively. Ultimately if the buyers are to take more control, getting back above those levels is the minimum targets to confirm a more bullish bias.
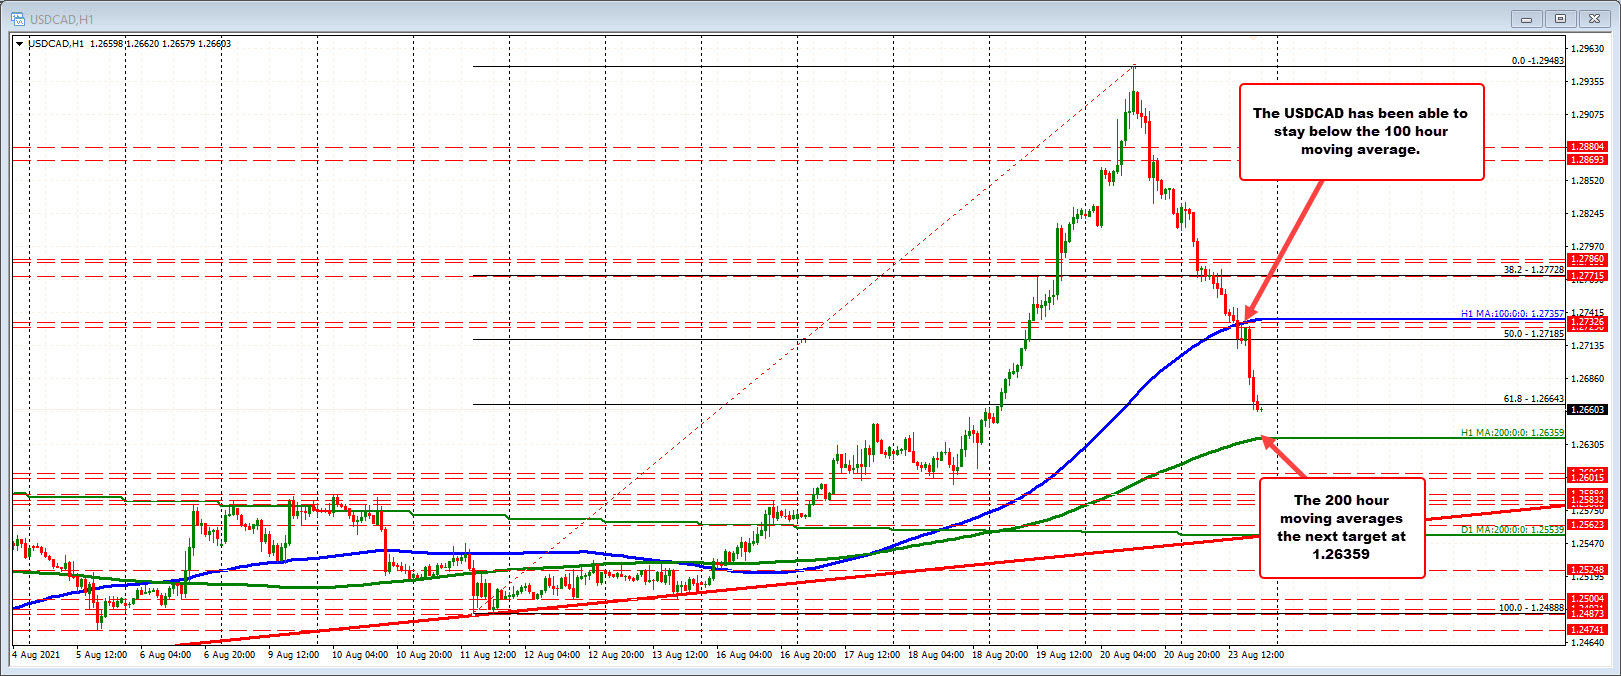
Meanwhile, the USDCAD continues to fall partly reaction to the rise in oil prices. Earlier today, the price fell below its 100 hour moving average (blue line currently at 1.27357 - see chart below) and the 50% midpoint of the move up from the August 11 low. The price has now reached to and through the 61.8% retracement at 1.26643 and targets the 200 hour moving average at 1.26359. I would expect buyers to lean against that moving average level on the first test.