
Moves to highest level since January 21, 2019
The official resignation of PM May has not swayed the EURGBP too much. The pairs is up on the day. If the pair closes higher (closes at 0.8830) it would be the 15 straight day higher. On Wednesday the pair moved above the 200 day MA (currently at 0.87853). On May 15, the pair moved above its 100 day MA (blue line) at 0.86751.
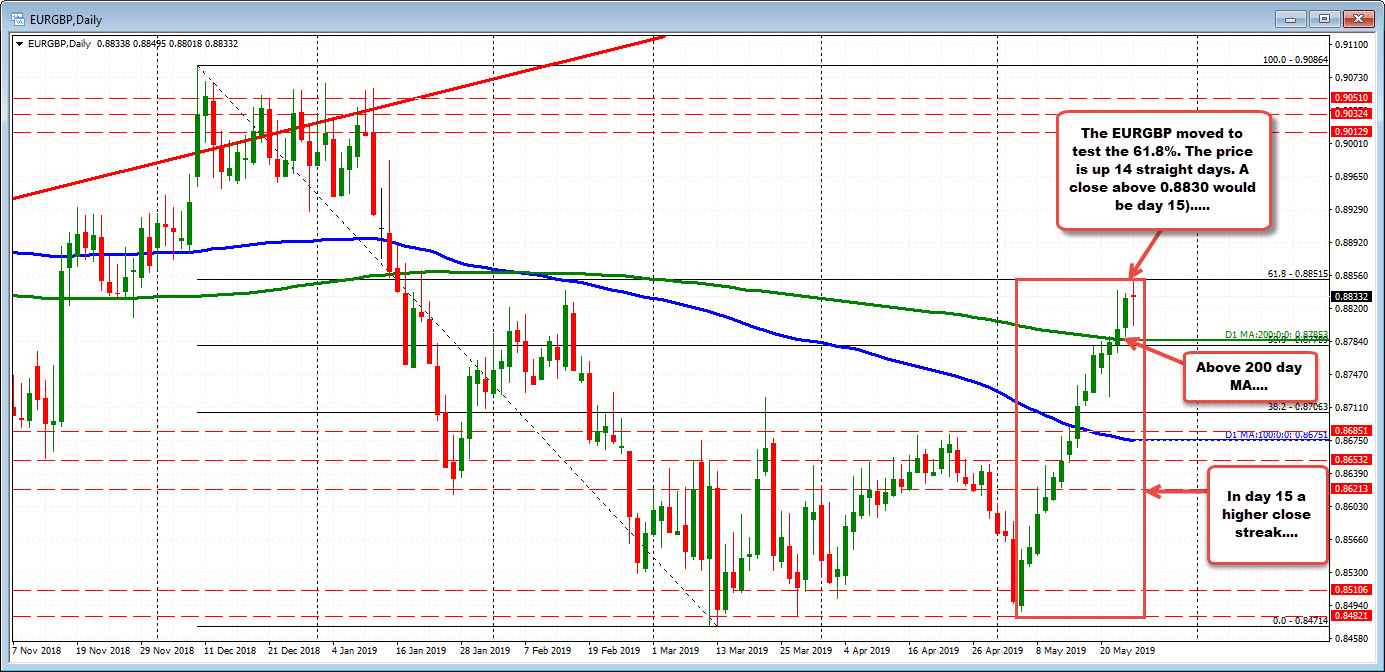
Today, the pair is approaching the 61.8% of the move down from the December 2018 high to the March low. That comes in at 0.88515. The high today stalled just short of that level at 0.8495.
Is the high in?
It is oh so tempting to sell the 15th day higher as a trade. The 61.8% does provide a level to lean against.
Any other clues that would weaken the technical picture?
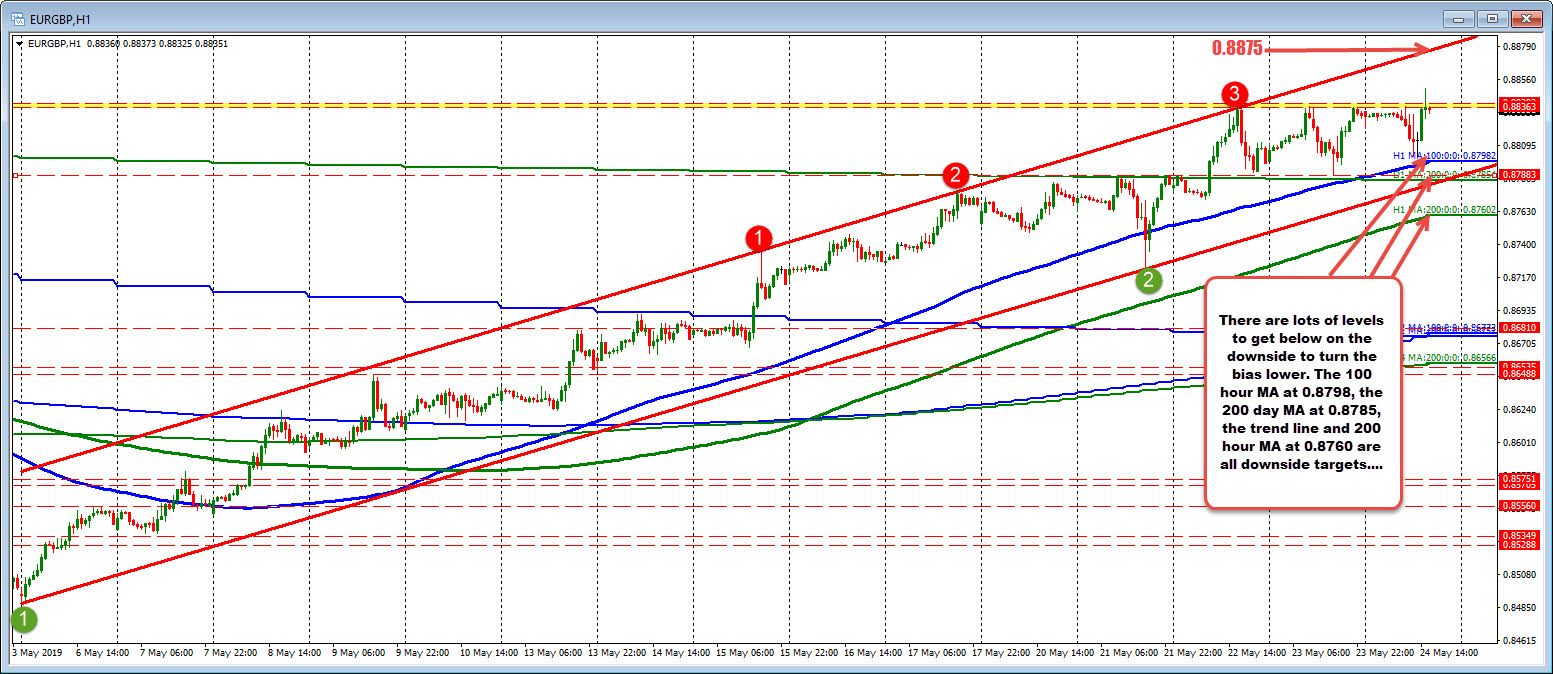
Looking at the hourly chart below, the pair moved above highs from yesterday at 0.8836 to 0.8839. That is just above the close from yesterday at the 0.8830. The low just reached 0.88325 on the current bar.
Moving below each would be a step in the bearish direction. It is the very minimum, but it is a step lower. IF that can't be done the buyers are still in control.
Below that area, the 100 hour MA at 0.8798 (and moving higher - blue line) is the next hurdle, then the 200 day MA at 0.8785.
The lower channel trend line cuts across at at 0.8782 and the 200 hour MA at 0.8760 are all increasingly more bearish steps on a correction (or selling clues).
For now, the pair remains above the close and near the swing area.
PS if the sellers are not ready to give up, and the 61.8% is broken at 0.88515, the topside trend line on the hourly chart comes in at 0.8875 (and moving higher). I would expect sellers to respect that line on a test.

