
EURUSD above key MAs and trend lines...
The EURUSD peaked on September 1 at 1.20105. The move above the key 1.2000 level was short and sweet (only a part of an hourly bar).

Looking at the daily chart above, the subsequent move lower took the price last week to a low of 1.17518. That was good enough to take the price below a lower upward sloping trend line (near 1.18147 currently) but the pair's fall did stall near the low from August 27 near 1.1752. On Friday, the price reestablish support (see green numbered circle 5) near the old lower trend line. In the new week, getting below that trend line would be needed to tilt the bias more to the downside. Failure to do that, and the buyers remain in control.
Drilling to the hourly chart below, the bounce near the August 27 low was able to extend the price back above the pairs 100 hour MA (blue line) on Thursday after a failed attempt on Wednesday. Near the close on Thursday and into Friday the pair retested that MA line (blue line) and found support buyers. Buyers remained in control.
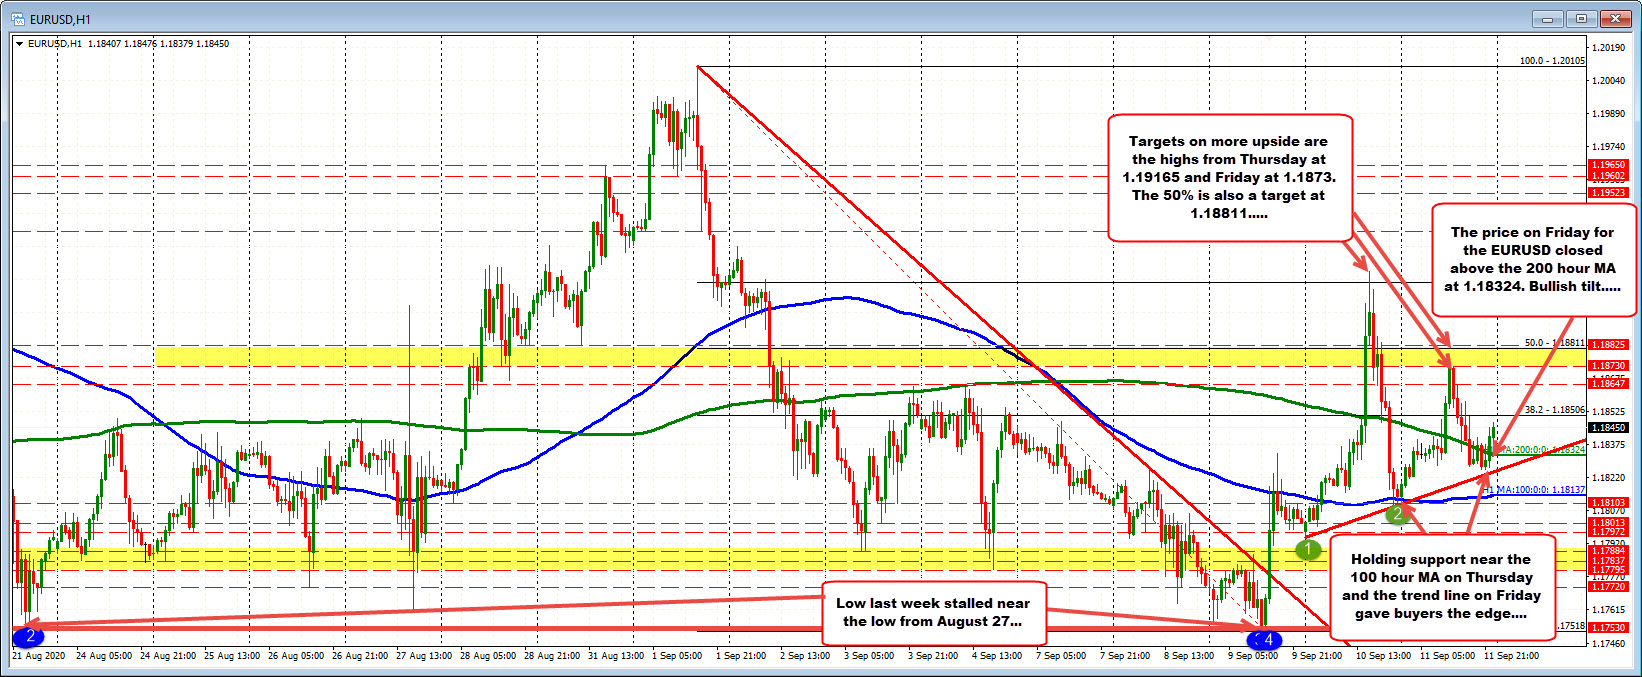
That is the good news for the buyers. The not so good news is the pair did extend all the way to 1.19165 on Thursday before tumbling to 1.0809 (and near the 100 hour MA).
On Friday, the price action saw more ups and downs, but the price held a lower trend line (currently at 1.18252 and moving higher). The pair also closed the week above its 200 hour MA (green line) at 1.18324.
It is good the 100 hour MA stalled the fall (at 1.18137), the trend line on Friday stalled the fall as well (at 1.18252), and the price is entering the week above the 200 hour MA (at 1.18324 currently). All are more bullish. The tilt is to the upside above those levels in trading this week.
However, there is some apprehension entering the new week given the sharp up and down activity on Thursday and to a lesser extend on Friday. Stay above the aforementioned levels and all is ok. However, the targets above will also be eyed for a more bullish tilt. Those targets include:
- The 38.2% at 1.18506
- The high from Friday at 1.1873
- The 50% at 1.1881 and
- The high from last week at 1.19165
We will see how the battle continues this week, but the levels are defined (on both the daily and hour charts), and should give the traders the needed bullish or bearish clues for the next move.

