Lower high today
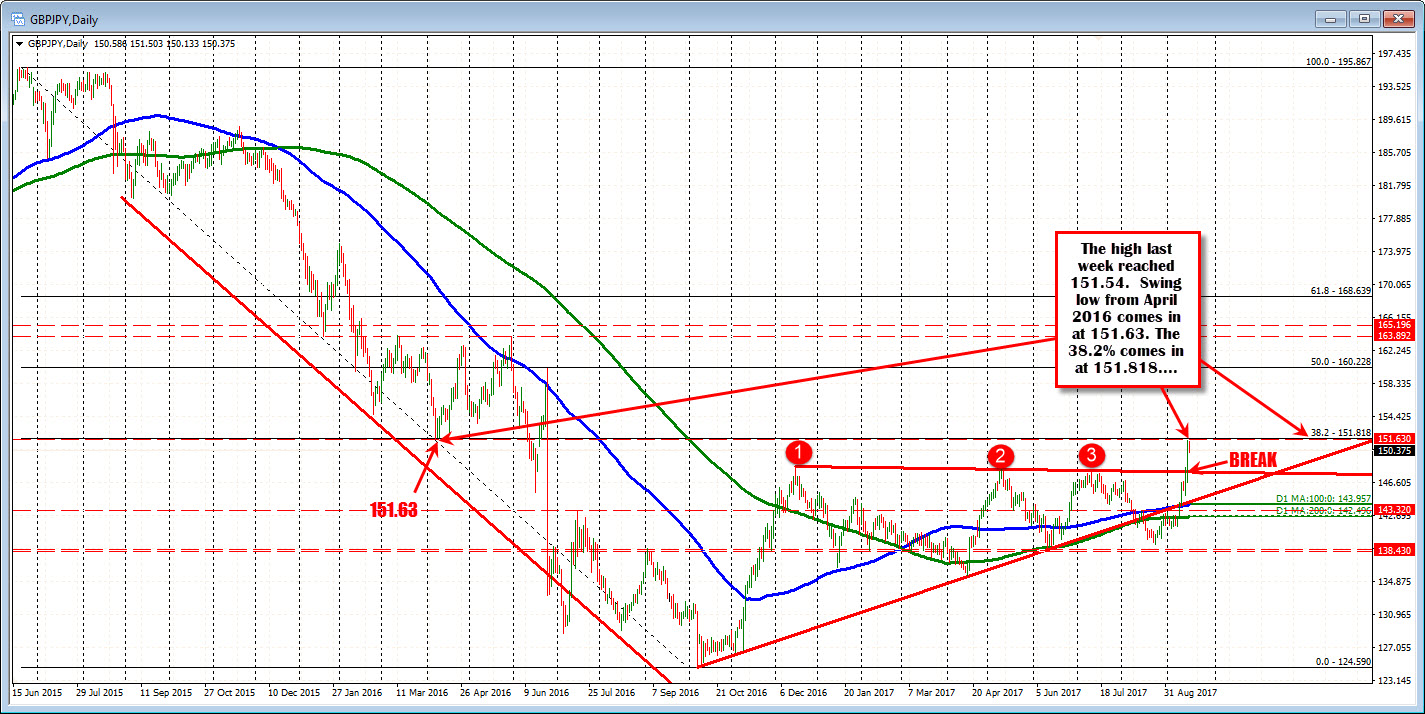
Last week, the GBPJPY surged higher. The close on September 8th closed at 142.23. The high price on Friday stalled at 151.54. The high came up short against the 38.2% retracement of the move down from the June 2015 high at 151.818. It also came up short against a swing low from April 2016 at 151.63 (see daily chart below).

Today, the high could only get to 151.50. We have an up and down move lower.
What kind of corrective move lower have we seen?
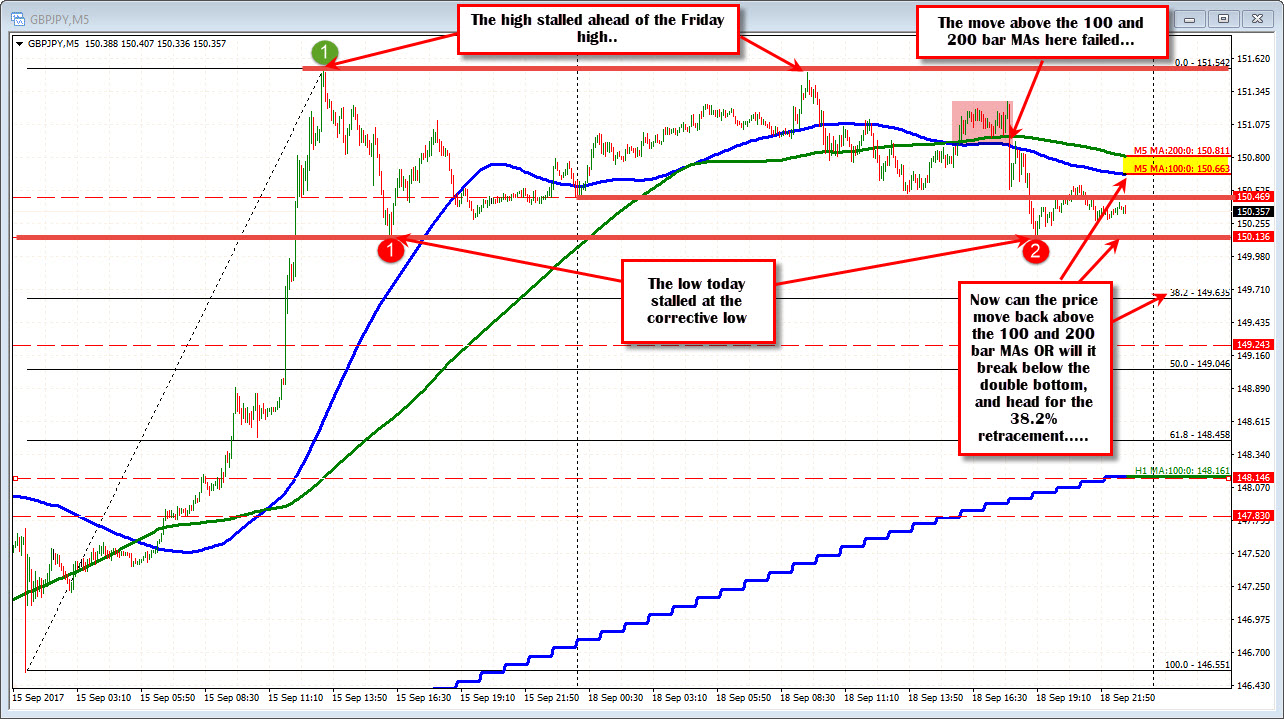
Drilling to the 5-minute chart below, you can see the stall point ahead of the high from Friday. The initial wander lower stalled ahead of the Asian low. Another rally in the NY session got back above the 100 and 200 bar MAs (blue and green lines), tried to stay above those MA levels, but failed. The fall on that final break (below the red shaded area), went down to test the low corrective price after the high on Friday at 150.14. The low today reached 150.133. Close enough to a double bottom.
What next?
We currently trade below the 100 and 200 bar MA on the 5-minute chart below at 150.665 and 150.815 respectively (yellow area). Stay below keeps a lid on the pair. We should see and extension lower Move above and a move back toward 151.63 and the 38.2% on the day at 151.818 will be eyed (see daily).
ON the downside, the double bottom at the low today, will now be eyed by sellers. Get below, and there can be a rotation toward 38.2% of the move up from Friday at 149.635.

A little battle going on. Buyers perhaps taking some profits today but limited in scope. It is hard to tell if the fall is enough. So watch the technicals for the next clue.


