Up and down
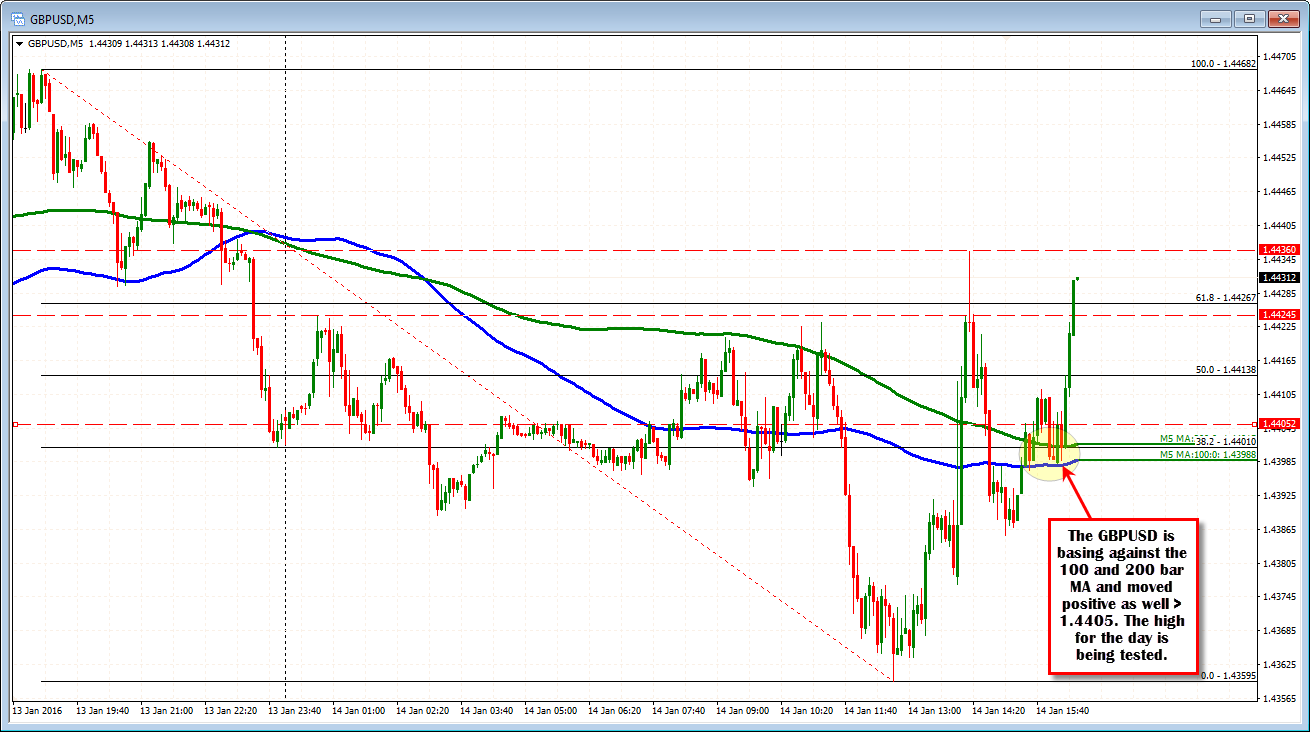
The GBPUSD is pushing higher in the last few minutes of trading. Looking at the 5 minute chart, the price is basing off of the 100 and 200 bar moving averages (blue and green line in the chart below at .4398 and 1.4401, respectively). The price is also moving away from the closing level from yesterday at the 1.4405 level. The high for the day is being approached at 1.4436. The range for the day is a narrow 76 pips vs. the average over the last 22 trading days of about 108 pips (22 days is about a months worth of trading). SO there is room to roam on a break.

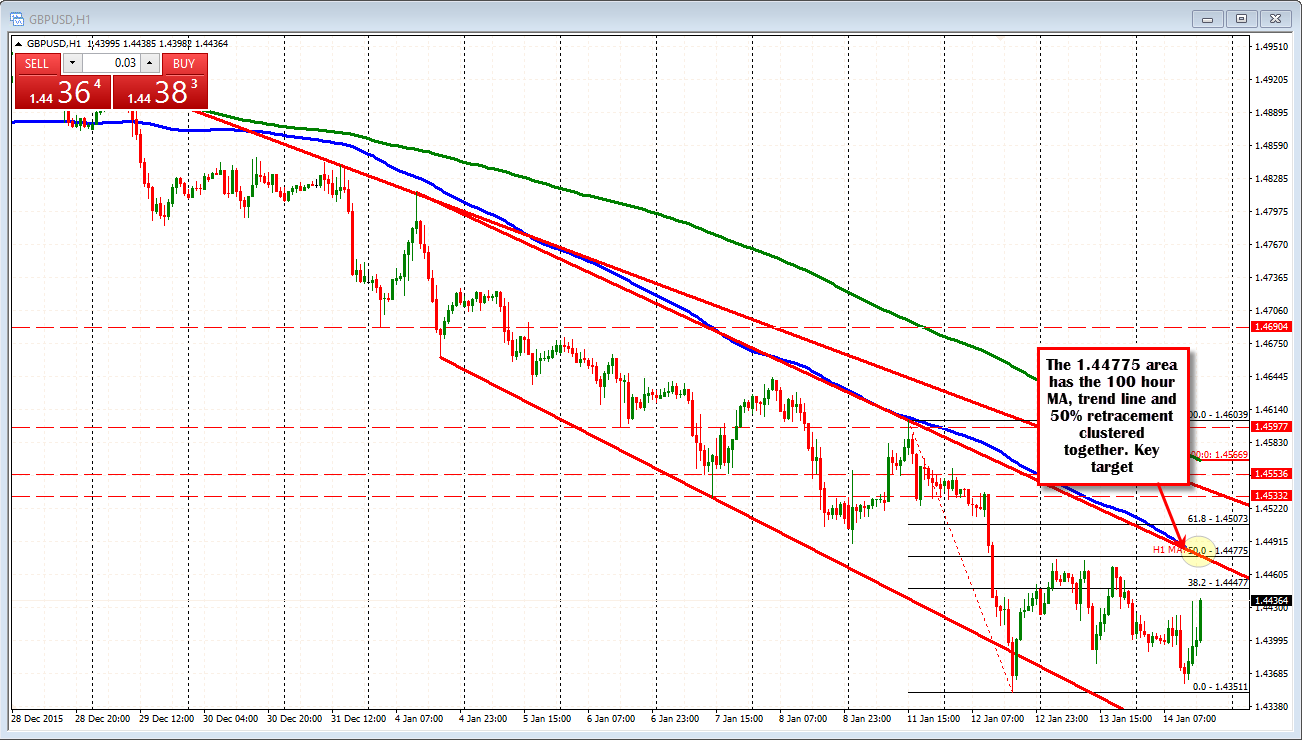
Looking at the hourly chart, the 38.2% retracement of the move down from the January 11 high comes in at 1.4447. The 50% and the 100 hour moving average and the topside trendline all come in at the 1.4477 level. These would be targets on a break higher.


