Tests 61.8% of the 2017 trading range at 114.289. High reaches 114.238
The USDJPY pushed up to a London morning session high at 114.238, and could not be that level after better-than-expected durable goods and house price index data this morning. Higher US yields with the 10 year peaking at 2.4736% could not extend the trading range.
So buyers turned to sellers and the price has now moved back below the 114.00 level. The current price trades at 113.90.
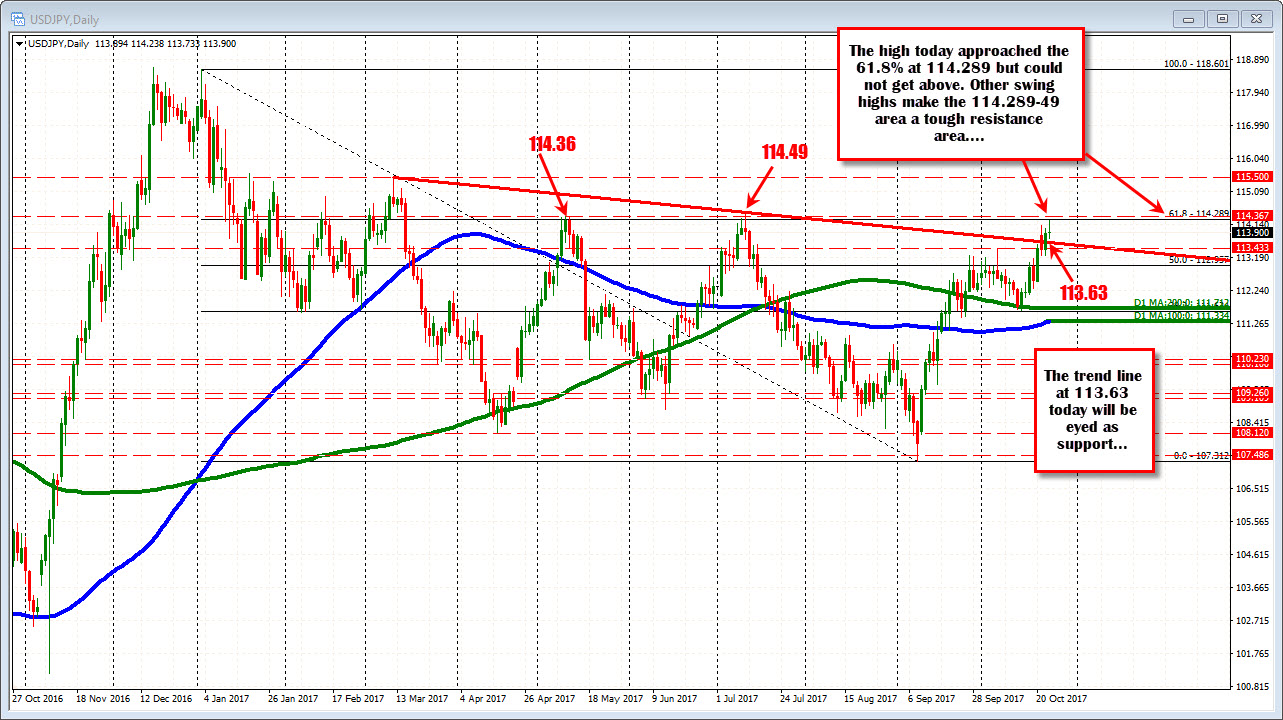
Looking at the daily charts, the pair did get closer to the May and July 2017 highs at 114.367 and 114.49 (well kinda). That area between 114.289 and 114.49 is a key upside target. On the downside, the pair broke and closed above a topside trend line (currently at 113.63). That level on the daily chart will be eyed going forward.
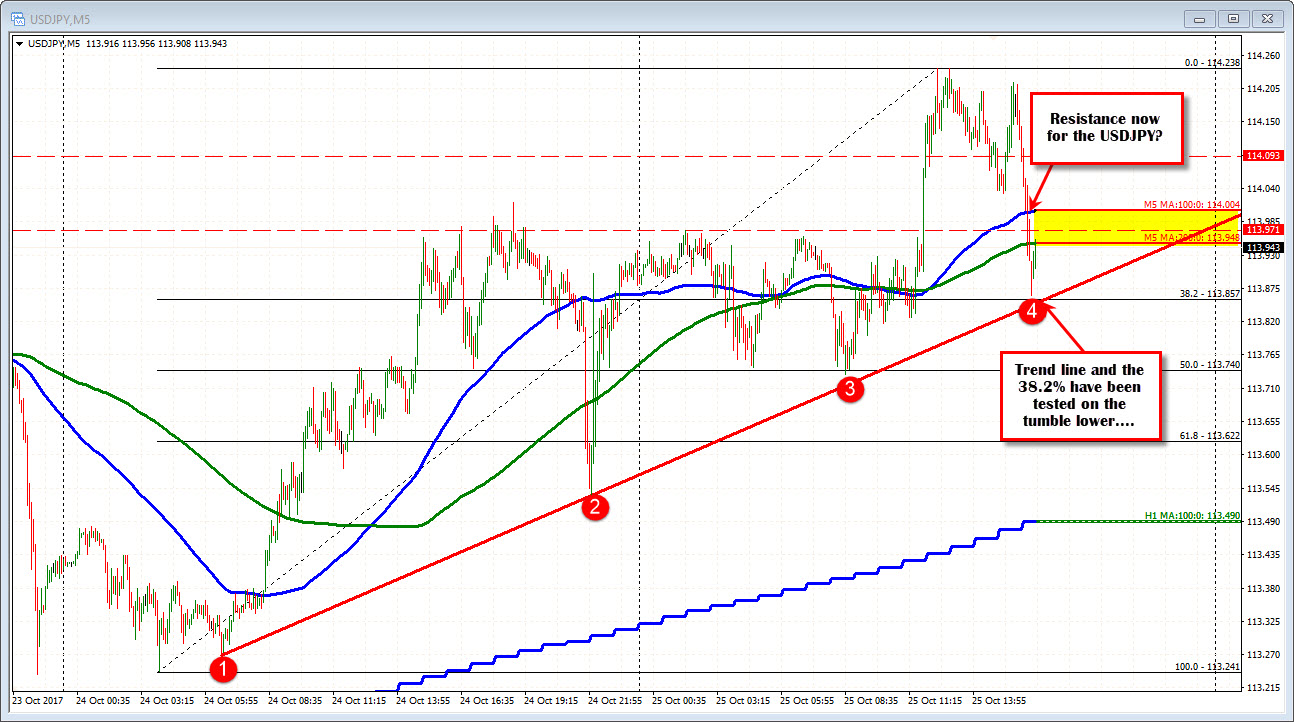
Drilling to the 5 minute chart, the pair has moved back below the 100 and 200 bar MAs (and earlier ceiling from the Asian session at 113.97). The price is testing the 38.2% of the move up from the low last yesterday and trend line support (see chart below). Is the 114.00 now resistance intraday? If the sellers are making a play now that should be a ceiling.