Trend line or RSI...
Here is an example of USDJPY trending higher. The daily range was 112 pips compared to the average range of 88 pips. So from that perspective the market was "overbought" relative to the average range.
Traders will also often look at a relative strength index to determine overbought (or oversold) conditions.

Using an RSI overbought sell signal.
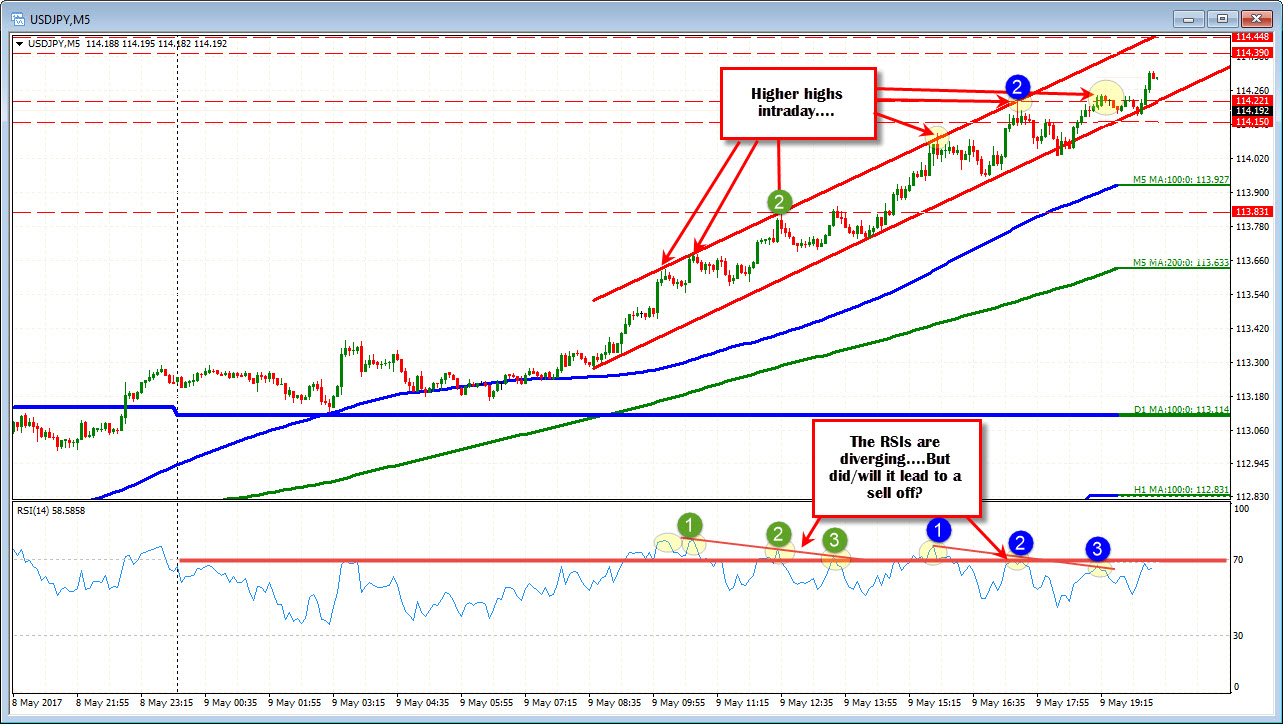
Below is the 5-minute trend of the move higher in the USDJPY along with the 14 bar RSI below. In a nutshell, if the RSI gets above 70, the market is overbought. It does not mean to sell, but it suggest that the market is overbought. The yellow circles are where the RSI peaked after moving above the 70 overbought signal line.
If you follow the times the price moved above the Red 70 RSI line today, the price did not really come off right away (i.e the price can move higher and the RSI can go higher too). When the price did start to decline, the declines were somewhat shallow. In other words, there has not been a lot of pips in trying to sell overbought RSI tops.
For example, if you sold when the RSI was near 80-81 at green circle 1 (and the market was overbought), the price only declined 11 pips before moving back higher...and higher....and higher with little in the way of corrections. In other words, you are losing money, even though the RSI said a number of times today, the pair was overbought.
This is the problem with using RSIs as a tool to define a trade. Trending markets can stay overbought. Corrections can be shallow as well. While you are expecting a meaningful retracement off a 81 overbought RSI, you may only get a much smaller move.
RSIs also does not define your risk If the trade is off the RSI and the price goes down 10-11 pips and then rises again, where is your stop? In the example, the RSI moved to the 70 level or above on 4 other occasions after the green circle 1. It is hard to define risk when trades are done with RSI's.
What about diverging RSIs?
Traders will sometimes look for diverging RSI's to signal a sell in an overbought market. What is a divergent RSI? A divergent RSI situation occurs when there is a higher high, but the RSI is lower. Looking at the chart, at green circle 2 in the RSI chart, the RSI was lower than green circle 1 even though the price was higher. So higher highs in price but lower overbought RSIs.
Once again if you sold at the peak price at green circle 2 at 113.83 (in reality it would be less). the potential gain on the sale was relatively minor at around 12 pips before the price started to move higher.
Moving ahead, the RSI diverges again at Blue circle 1 and 2. Once again if you sold at blue circle 2 (in reality a few pips below) because the RSI was diverging, you would have had a decline of 15/16 pips, but the price has since moved higher and we trade at new highs. Where do you get out? Do you still hold your shorts even though the price is higher? The market can still trend and trend and trend.
RSI does not do well in a trending market
The rule is RSIs do a horrible job in a trending market. If you sold at green circle 2 because the RSI was overbought AND diverging, you are losing money and wondering "where do I get out".
This is exactly why, you will not see or hear me talking about RSIs. I have seen many a trader get hurt bad in a trending market by trading overbought (or oversold) RSIs or divergent RSIs.
Plus, trading RSI does not define or limit risk. If you sold 75 RSI because it was overbought, where do you get out? When the RSI is 65, 50, 40? What happens if the RSI goes to 80, 85, or 90? What does your fear do? When risk can not be defined, trader fear moves higher.
Can you use trend lines to define overbought?
If RSI does a bad job in a trending market and traders can get hurt bad, what is the alternative? Is there an alternative?
For me, I like to use trend lines to help determine overbought (or oversold). If I combine trend lines with a measure of the average trading range, I have a better idea of overbought (or oversold) conditions. Let me explain.

Looking at the same chart above without the RSI, the trend lines define a nice channel where the price is trending. In a trending market, the price will often follow that channel. At the top trend line, it is a proxy for overbought. That is the guard rail that should hold the trend.
When trading against a topside trend line (overbought proxy), I will also make sure I have targets in the direction of the trade, AND will also consider the average trading range.
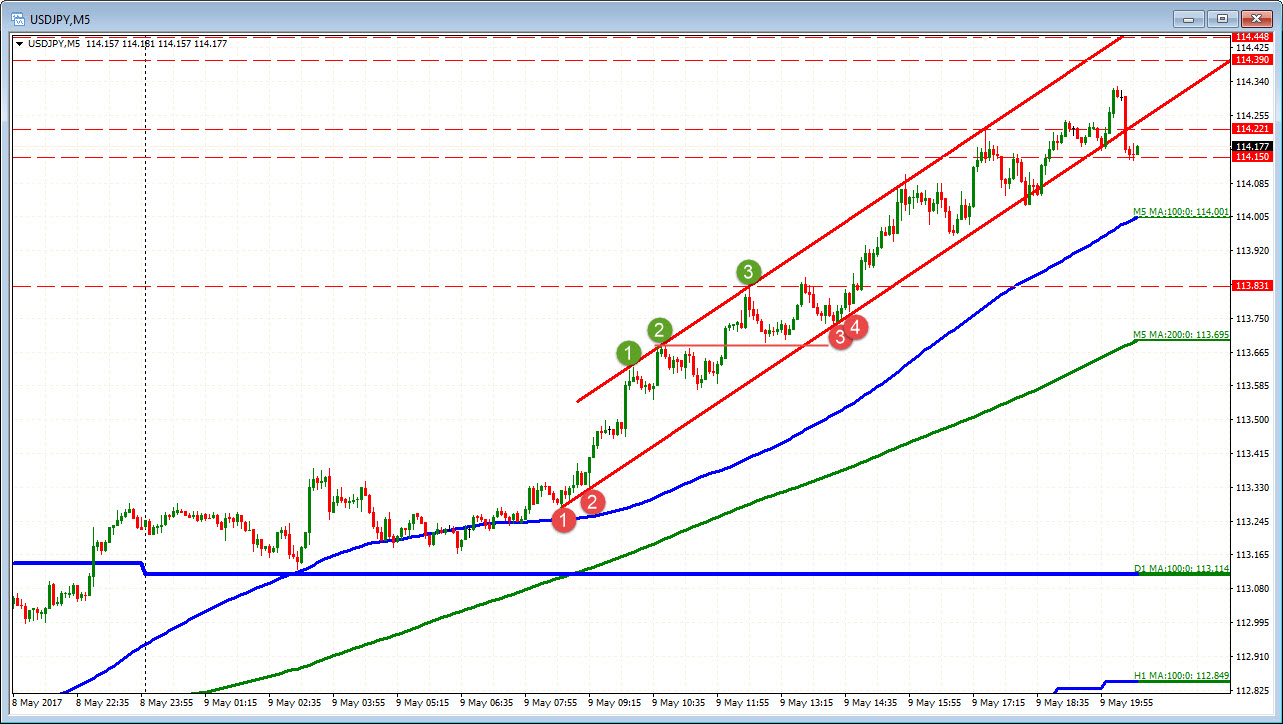
For example, at green circle 3, the price is testing a topside trend line. The range is about 70 pips. The 22 day average is 88 pips so it is not really overbought at that time, but risk can be defined against the trend line.
If I sold there, I would want to see, the price move lower, and get below the prior high at the very least. If the price cannot get below that old high, the sellers are not taking control. If they are not taking control, the price goes higher. It is as simple as that.
Assume, I sold against the trend line (with risk above on the entry - saw 5-10 pips). What do I want to see?
At the least, I want to see the price go below the prior high and then the lower channel trend line. If it does not happen, I look to get out.
In the example, the holding of the trend line at red circle 3 and 4 tell me to "get out of the short. The market is not overbought and has the potential to go higher".
Is the red circle 3 and 4 a good place to buy?
Sure.
- The channel trend line is holding.
- The range is below the average.
- The corrections are shallow.
- The correction could not get below the prior swing high (from green circle 2).
If you did that trade you got on the trend, and it continued to the topside trend line again.
What happens as the trend continues?
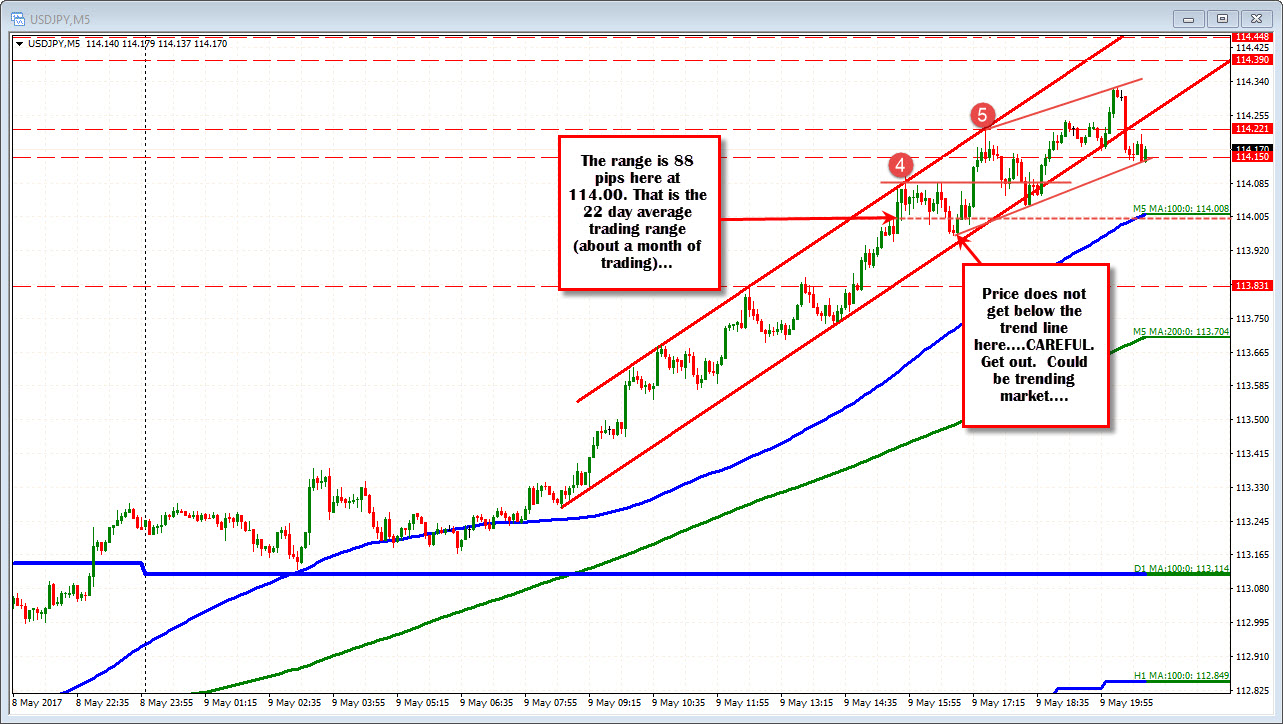
As the trend continues, so does the range. Eventually it gets to the 88 pip range at around the 114.00 level. The price moves above that average trading range. The market is trending but it hits the topside trend line at red circle 4.

Can you sell there (or take profit)?
Sure.
- The market is over the 22 day average range (potentially overbought?),
- Risk is defined by the topside trend line too (defines risk and the trend too).
Stay below the trend line is your risk. Where does the price need to go (i.e. the target)?
If I sold at red circle 4, I want to see the price move below the lower trend line. Does it? No. It get's close but can not break. If I don't get out with a small profit, I get out on a break above the high (and take a small loss).
What happens next?
The price goes up to Red circle 5. The range is extended and the trend line is tested. If you sold at Red circle 5, the price goes lower (risk is defined on the sale against the trend line) and the price does make it a few pips below the lower trend line. But what happens there? The price still stalls and starts to move higher. We have to respect the trend but risk is easily defined by the trend lines on entries above and also on the targets below.
When overbought is more clear...
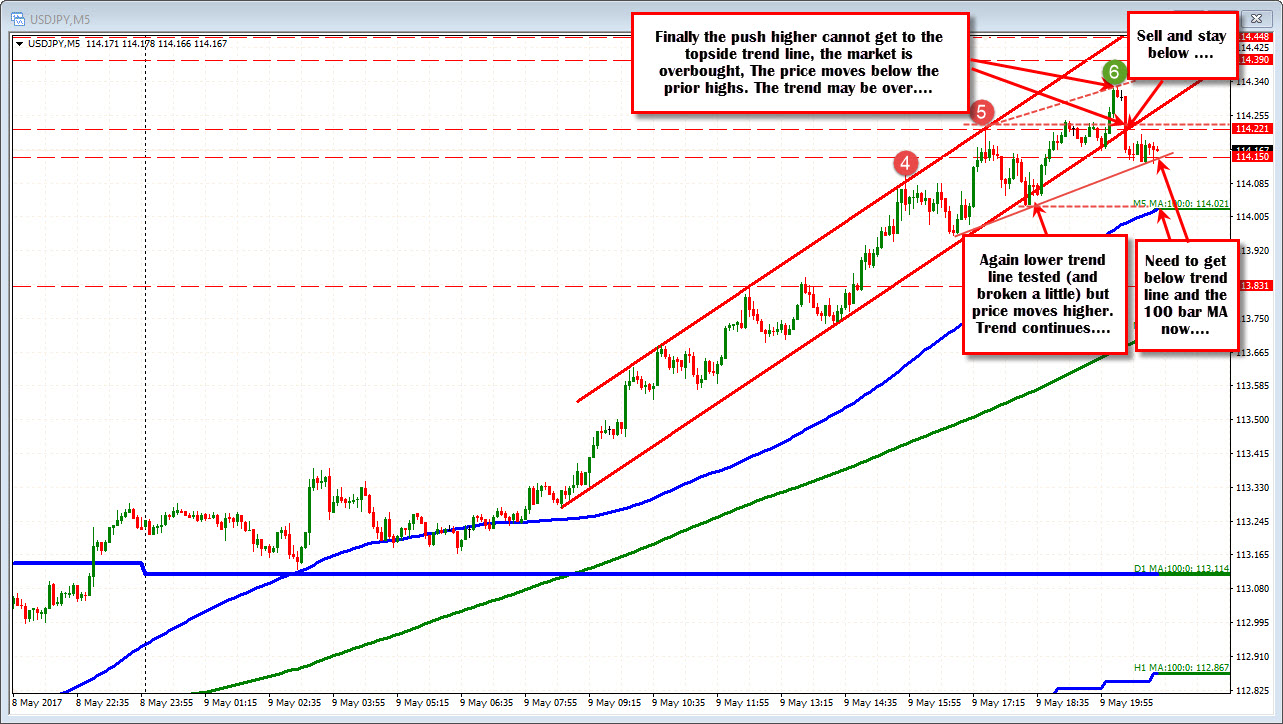
Finally at green circle 6 a high is made, the range for the day is 120 pips. IS the price near the topside trend line. So there really is nothing to sell against. However, when the price falls back below the prior highs at around the 114.22, what happens? Sellers enter. Why?

- Market overbought at 120 pips
- Price did NOT reach the topside trend line
- Price fell below prior highs.
- Price fell below lower channel trend line a few pips later
The price has moved lower. It is not running. So the short is not totally out of the woods. There is a trend line that needs to be broken below (see chart above) and then the 100 bar MA (blue line) is around the 114.02 level and a key level that needs to be broken. What is the risk?. Getting back above the sell area, or making new highs.
SUMMARY
RSIs are used to define overbought and oversold but can do a really horrible job in a trending markets. They also do not define and limit risk.
Trend lines (combined with the 22 day average trading range) can define overbought intraday levels and define and limit risk. Yes, you may sell, have the price go down and little and reverse back higher. It happens. However, you can often get out with a small profit or small loss at the worst case.
As a result, trend lines do the work of the RSI, only much better. You don't need a RSI to determine overbought or oversold.


