Price remains below its 50 hour moving average and 38.2% retracement.
The US stocks are higher but off the day's highest levels. The NASDAQ composite index is currently up about 57 points or 0.73% at 7881.06. The high extended to 7899.945.

At the highs, the pair fell short of its 50 hour moving average and 38.2% retracement of the move down from the September 12 high. Both those levels come in around the 7907.73 area (the high could only get to around 7900).
The inability to extend above those levels, keeps a lid on the bullishness seen today.
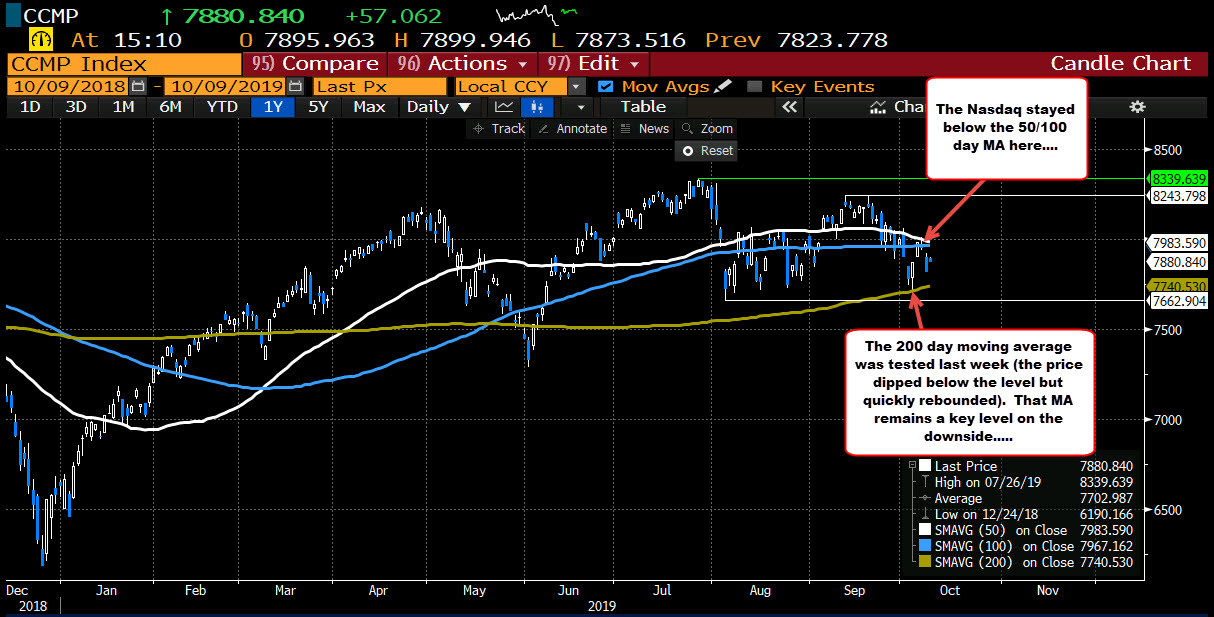
Taking a broader look of the daily chart below, the index remains between moving average support and resistance levels.
On the downside, last week the price tested its key 200 day moving average (green line) and found willing buyers. However, on a topside, the rally off those lows stalled near the 100 and 50 day moving averages (blue and white MA lines at 7967.16 and 7983.59 respectively).
The current price is between the two longer term areas.