
50% of move down from September high comes in at 1.2591.
The USDCAD moved up to test the 50% midpoint of the move down from the September high at 1.2591 during trading yesterday. The high price reached 1.25955, before rotating lower into the close. In trading today, the price waffled up and down again. This time the high extended to 1.26038 only to again fail and rotate back below the 50% retracement level.
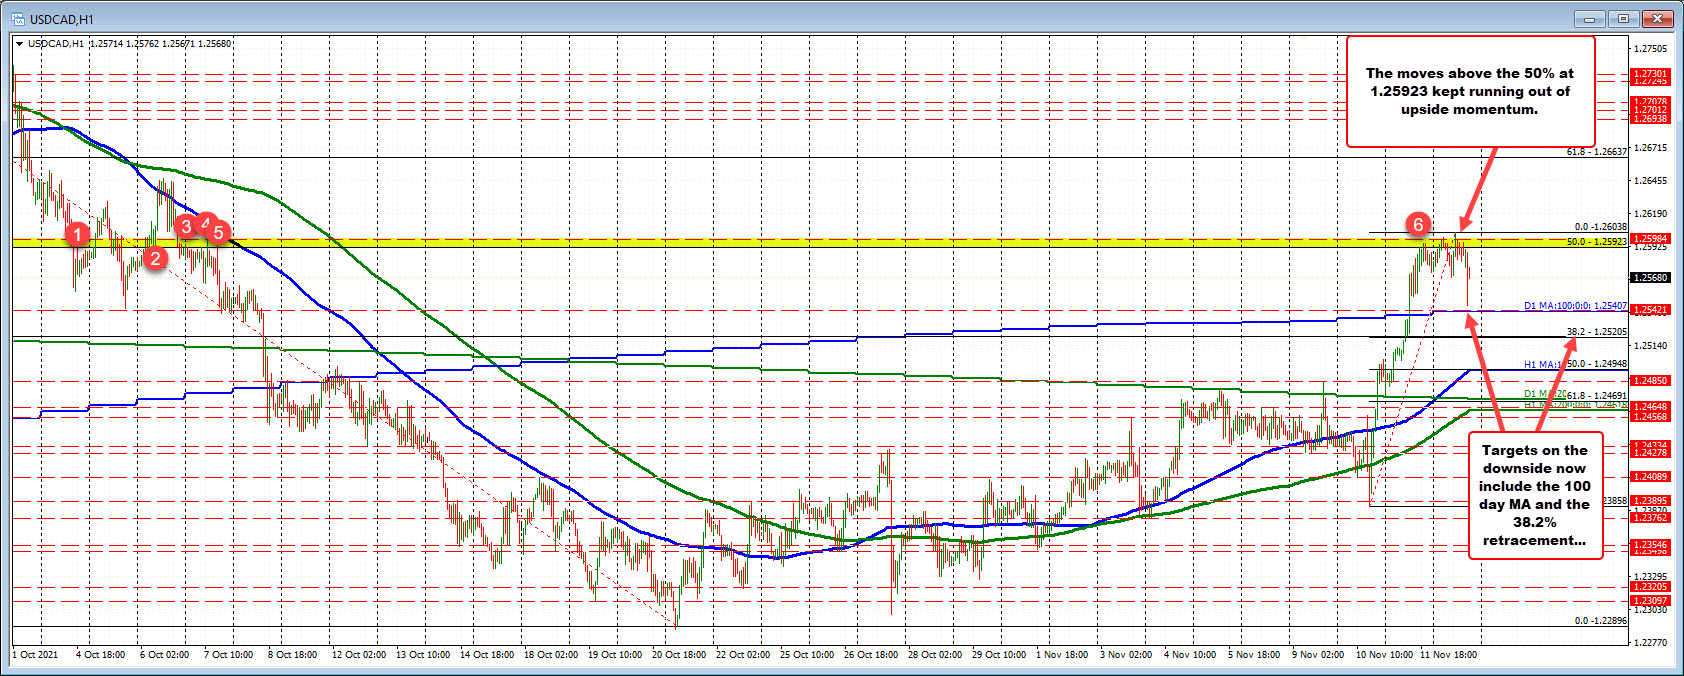
The move to the downside has seen the price move back toward the broken 100 day moving average at 1.25407. The low for the day reached 1.25457 just five pips from the key level and bounced higher. The current price is trading at 1.25641.
Going forward, as long as the 100 day moving average can hold support, that keeps the buyers still in play/control with hopes of getting above the 50% retracement level again and finding more buyers.
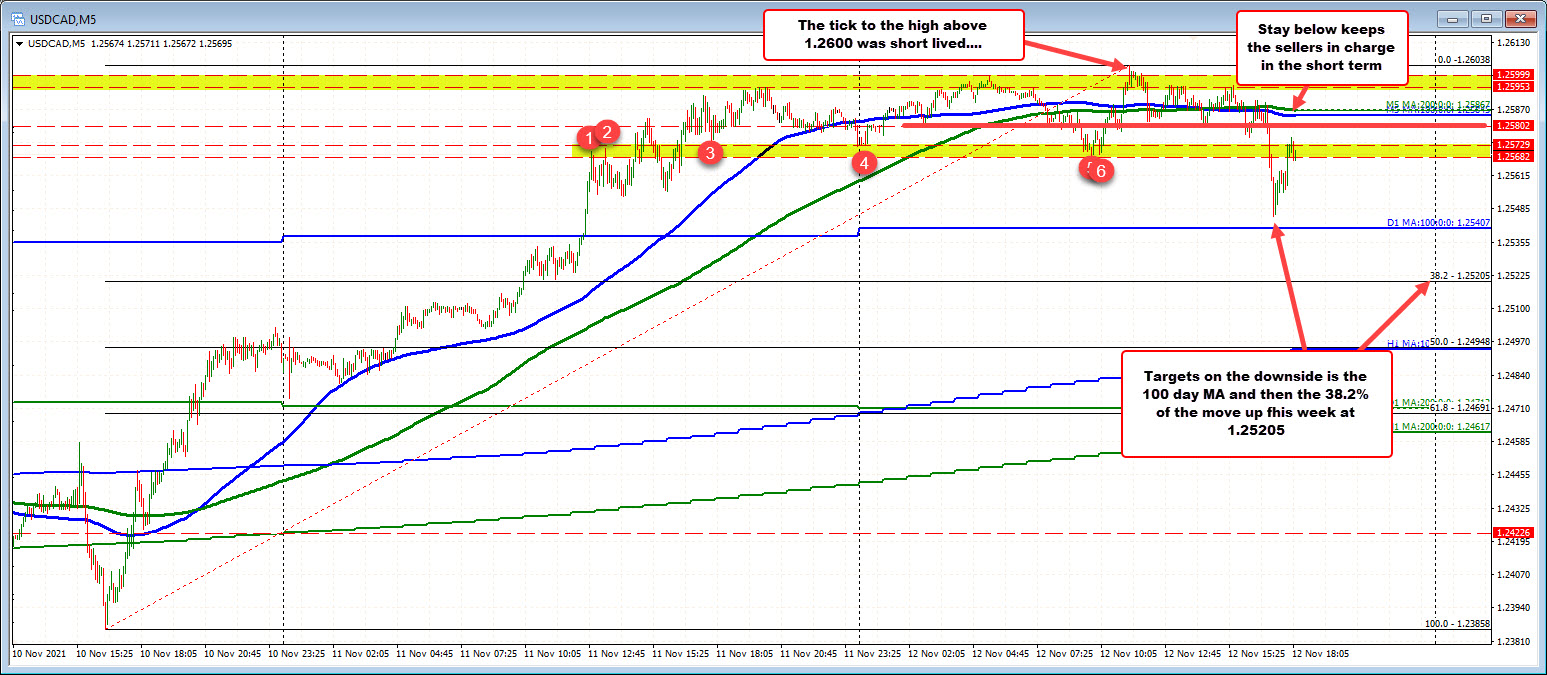
Drilling to the five minute chart, the run higher from the Wednesday low started to lose momentum near the 50% retracement level and highs yesterday. The 100 bar moving average started to catch up with the price (blue line in the chart below). The 200 bar moving average caught up as well today. That dynamic is classic in that the trend transitions to a nontrend/corrective trading environment near resistance (the 50%).
Over the last hour or so, the price started to lean against the swing areas near the high and then found sellers near the converged 100 and 200 bar moving averages. Falling below the floor at 1.2568 to 1.2573 led to the continuation run toward the 100 day moving average.
Buyers definitely came in against that longer-term moving average level and pushed the price back to the old floor area. Getting above that lower yellow area and then the 100 and 200 bar moving average would increase the bullish bias from an intraday trading perspective (and keep the interemediate trend higher intact too). That is what traders will be focused on for the rest of the day.
It's Friday. The market had a nice run toward the 50% retracement level and 1.2600 level that found sellers. The correction move down saw the price test the key 100 day moving average.
It might just be that market stalls within the range and looks forward to next week's trade when buyers and sellers can decide:
- Go below the 100 day moving average and restart more downside momentum, or
- Move back above the 50% midpoint and move higher.
Those are the key levels and the price trades between those extremes.

