
It traded down 100 pips before racing higher. Up about 270 pips now.
The GBPJPY has led the charge higher today. The pair soared on the back of pounds bullish surge after the BOE/Carney comments this week (see Adam's post here). The JPY was sold today too. Is the market viewing N. Korea comments of "sinking Japan" and missile firings as a negative for JPY now? Today it looked that way.

The GBPJPY has a near 500 pip trading range (491 pips on my platform). The pair moved down about 100 pips before snapping back higher and rallying near 400 pips. We are currently up about 263 pips.

What did the price action do for the technicals?
Taking a broader look at the weekly chart (see chart above) for the pair, the price rise today (and this week) was able to push above trend line resistance at 147.83 and the highest high going back to the December 11 week high at 148.44. Later the 100 week MA at 149.24 was broken. That was the first break above that MA since December 2015. KEY BREAK.
Both of those breaks are major. The pair is breaking out. Traders should now use those levels as risk defining levels.
Keeping on the weekly chart, the high today reached 151.54. The 38.2% retracement of the move down from the 2015 high comes in at 151.818. Looking back to 2016, there was a swing low at 151.63. Getting within 9 and 27 pips of the next targets is not all that bad. Especially after a near 500 pip trading range. Even strong trend moves do tire. It seems that the market may have used those levels as a place to take profits?
Does the holding below the targets hurt the bullish move?
Whenever a target area holds, it can potentially lead to a reversal. However, the breaking of the trend line on the weekly, the breaking above the November 2016 high. The cracking above the 100 week MA are all key breaks. So despite the hold above, I still give the nod to the buyers.
What would change that view?
The easy answer is a move back below the 100 week MA at 149.243. Stay above the 100 week MA and the bulls are in control.
Anything closer that might lead to a further correction lower. Putting it another way, is there a dip point where buyers should come in and by on a dip. After all it does take buyers to go higher.
Drilling to the 5 minute chart (see chart below), midday there was a pause of the trend just above the 148.44 level That level - from above - was the high price going back to November 2016. The market based against that level and trended to the high of 151.542.
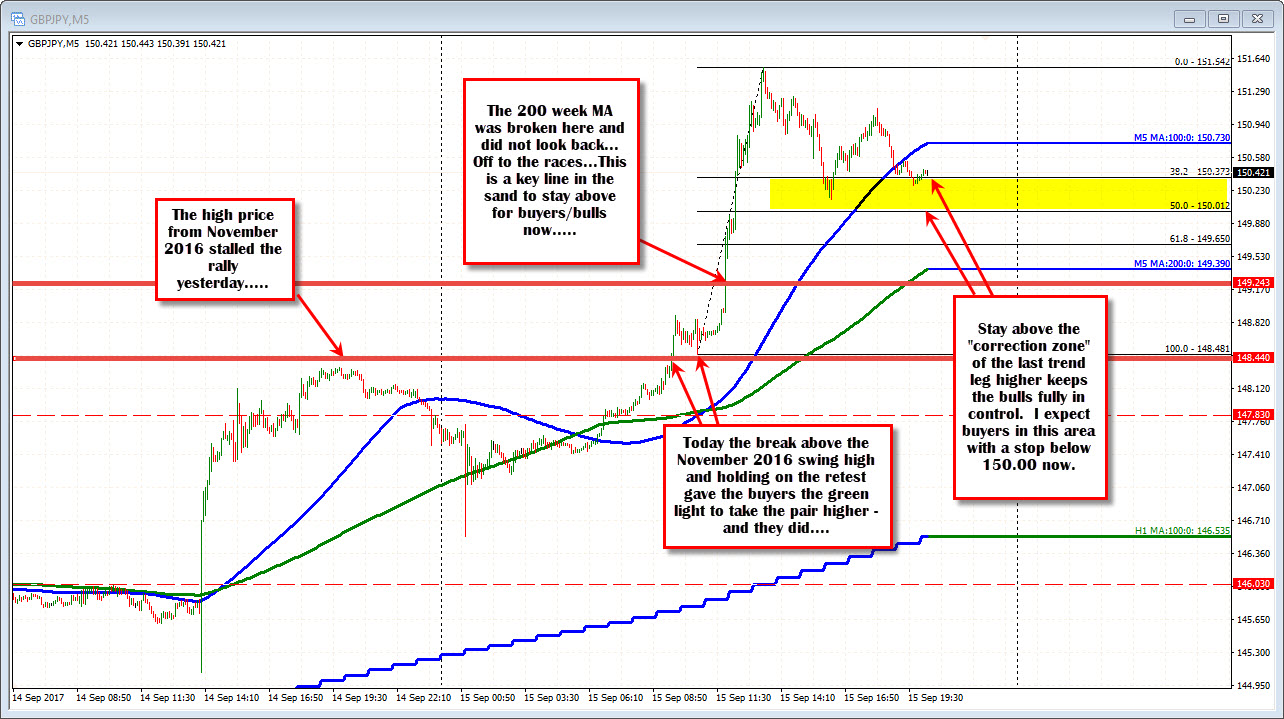
If you put a fibonacci on that trend leg, the 38.2%-50% retracement of that move comes in at 150.01-150.37. The low since the high stalled between those levels. We currently trade around the 38.2% retracement.
If the buyers are to keep full control, I would expect buyers in this area. Traders who want to jump on the bullish train, should come in after a 120-150 pip dip.
So look for buyers to enter against a stop below the 150.00 level. A move below would look toward the 100 week moving average at 149.24.
If the correction zone holds support, look for a retest and potential break of the 38.2% retracement at 151.818. Above that and the road opens up more for the pair.

