
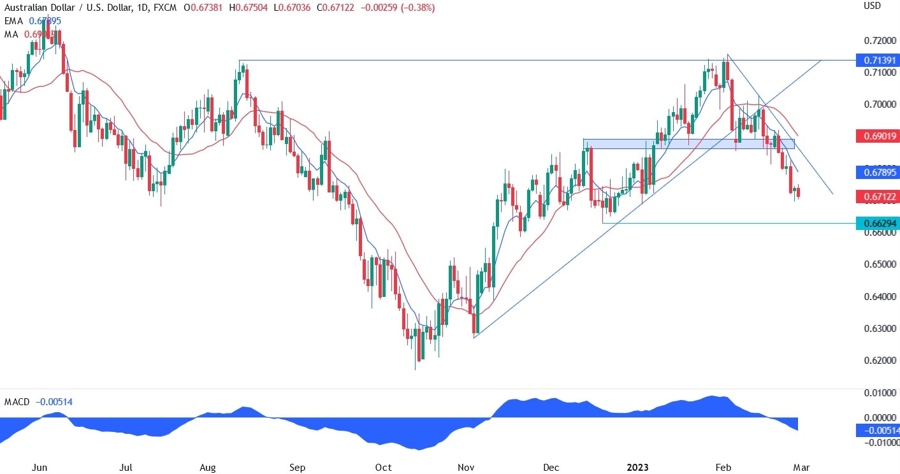
On the daily chart below, we can see that the sellers eventually managed to break the key support level in the 0.6850 area. This breakout led to a deeper selloff and the sellers are now eyeing the 0.6629 level. If the sellers manage to break that level as well, then we may see the price falling to the 0.63 handle next.
The moving averages are clearly pointing to a bearish trend now and they will act as resistance for the sellers along with the downward trendline. Right now, the price is a bit overextended as we can see from the price being too far from the blue short period moving average. Generally, we can see a pullback or some ranging price action before another push in the original trend.
On the 4 hour chart below, we can see how the price broke with strength the support zone in the 0.6850 area. What gave the sellers the momentum were the US PMIs on February 21st as those are based on the month of February and not on the month of January like the previous reports.
The market was tentative breaking the support, because there are talks of seasonal factors skewing the data in January, so the PMIs gave the sellers more conviction that it may be a real change in trend and not just a blip due to seasonal factors.

On the 1 hour chart below, we can see that the 38.2% Fibonacci retracement level found sellers on the first try. We may see another push upwards today as month-end flows are impacting the FX market since yesterday. A break of the trendline may trigger a bigger pullback towards the 0.68 handle or even higher towards the major trendline.
A break below the 0.6698 support should give the sellers conviction for a move towards the 0.6629 level. We will have key economic data like the ISM PMIs this week and beats to the expected numbers should be bearish for the pair while misses should be bullish.


