The EURUSD pair experienced a decline in today's trading session, with its high price for the week coming in just short of last week's peak. This event coincides with notable swing areas dating back to late January. The recent high prices were observed on the 4-hour chart, with today's highest point at 1.0925 before retreating downwards.
The current trading session saw the price drop to 1.08635, dipping slightly below the low end of a significant swing area (between 1.0866 and 1.0886). As market participants await the release of PCE data, the EURUSD is trading at 1.0874. The anticipated month-to-month core PCE index increase is 0.4%, with the year-on-year figure remaining steady at 4.7%. Meanwhile, personal consumption and income are projected to rise by 0.3% and 0.2%, respectively.
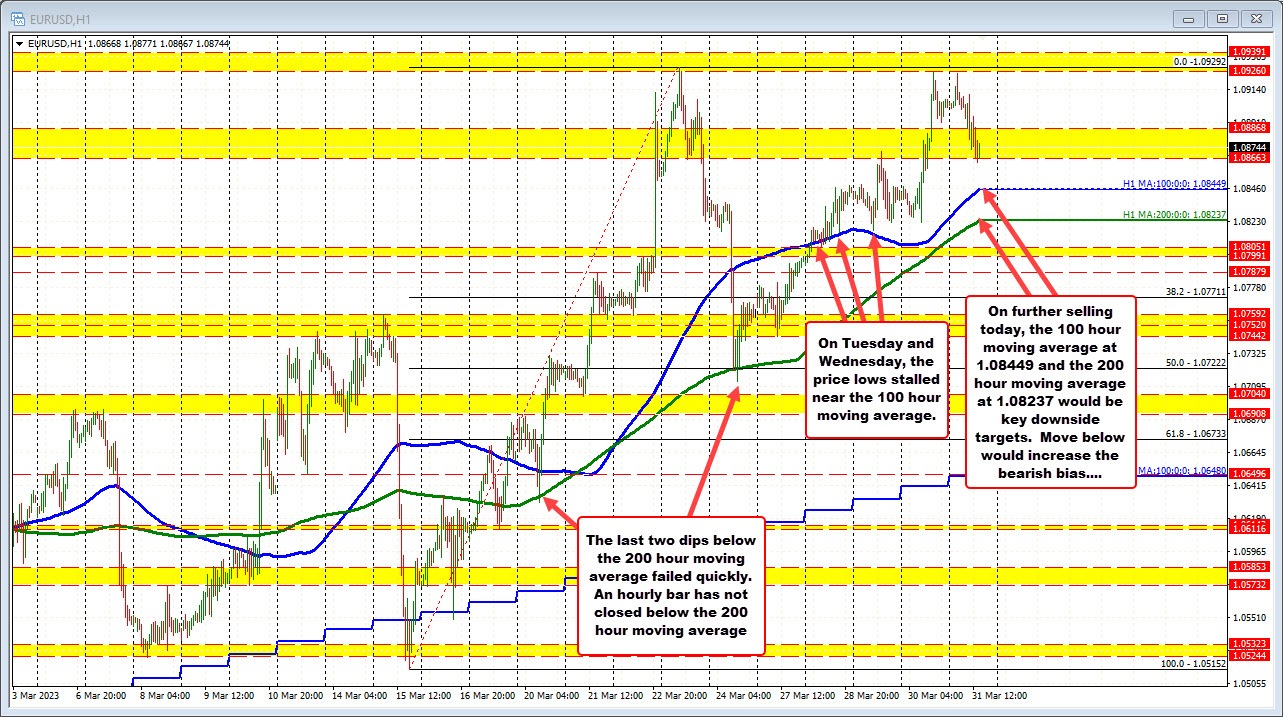
In the short term, a further decline below the 1.0866 swing low could trigger additional bearish momentum. On the hourly chart below, the 100-hour moving average (blue line) is situated at 1.08449, which has served as a support level during Tuesday and Wednesday's sessions. A fall below this average could prompt traders to shift their focus to the 200-hour moving average (green line). That moving average currently only comes in at 1.08237
It is worth noting that the price briefly dipped below the 200-hour moving average on March 20 and 24, only to rebound quickly and resume an upward trajectory. The last hourly bar to close below this level occurred on March 17. Be aware. A move below would put the sellers more in control.
On the topside today, a move back above 1.08868 would have traders looking again toward the swing high area between 1.0926 and 1.0939.