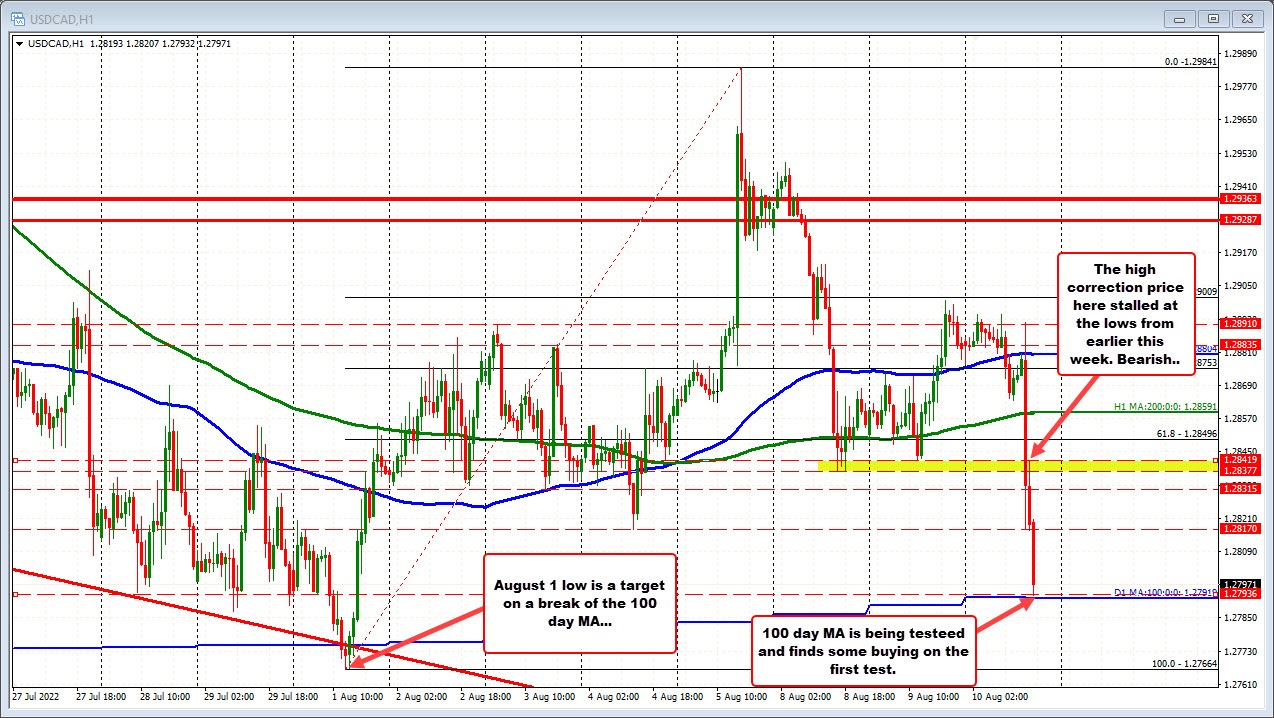
The USDCAD is moving to a new session low and in the process is getting closer to its rising 100 day moving average at 1.27925. The low price just reached 1.28009 (a natural support level as well).
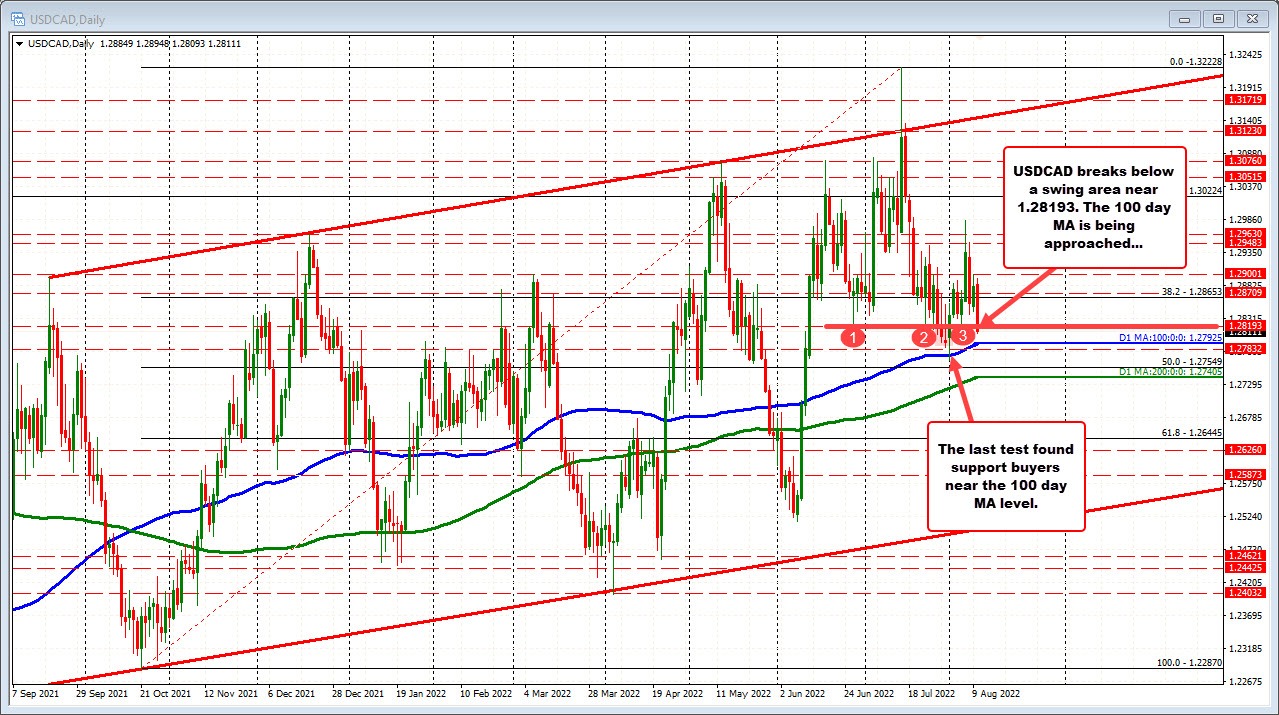
Going back to the 1st day of the calendar month, the price dipped below its 100 day moving average on its way to a low price of 1.2767. The 100 day moving averages at 1.2775, but momentum to the downside could not be sustained and the price rallied sharply over the next week or so.
There should be support buyers against the 100 day moving average on the test. A break below it and staying below would have traders looking toward the low from August 1 at 1.2767.
Drilling to the hourly chart, the corrective high off the 1st bounce AFTER the CPI, saw the price move up to test the swing lows from Monday and Tuesday between 1.28377 and 1.28419. Willing sellers leaned against the area. That was a go-ahead for the sellers to continue the trend to the downside and indeed the pair has run down toward the key 100 day MA (overlayed on the chart below).
Key test. A break below would have traders looking toward August 1 low at 1.27664. Holding the level and a bounce toward 1.2817 would now be close resistance (swing low from August 4).