

A chart pattern is a recognizable configuration of price movement that is identified using a series of trendlines or support and resistance levels. Chart patterns can signal reversals or continuation of trends, but they shouldn’t be traded alone without a fundamental bias backing the trade.
There are many timeframes that can be used and there can be many patterns at any given time that can make all the process confusing and detrimental. You should look at chart patterns as if they were a reflection of current market sentiment/momentum.
If you see, for example, price consolidating after a bull run caused by a fundamental catalyst giving you a flag pattern, you know that that can signal a further bullish momentum once the flag gets broken, but that’s going to happen only when the market has once again a reason supporting the next move.
Chart patterns can help you timing technically your entries and exits. Remember though that patterns will rarely look like textbook examples, because there’s a lot of noise in the market and you will often see spikes or “ugly” price behaviour that may make spotting patterns harder for you, so always be open-minded and don’t follow strict rigid rules like a robot, you always have to adapt in trading.
Let’s see now all the major chart patterns and how you can trade them:
Double Top/Bottom

As you can see in the picture above double tops or bottoms can signal areas where the market has made two unsuccessful attempts to break through a support or resistance level. Double tops look like an “M”, while double bottoms look like a “W”. You can even find triple tops or triple bottoms that have the same psychology behind them as for double tops and bottoms.
These patterns are considered reversal patterns, meaning that the price upon successful completion of the pattern goes the opposite way reversing the previous trend. Actually, reversal patterns can be used as continuation patterns. Let’s see some examples:

As you can see in the picture the general trend is up. Then we see a double top which signals a reversal as the market failed to breakout. What we see next though is a double bottom that worked much better than the double top. This is due to the underlying theme in the market. This is exactly why you should use chart patterns in conjunction with the fundamentals sustaining the trade to filter out the successful patterns from the unsuccessful ones. This way you will give yourself much more probability for your trades to play out.
Here you can see another example of a double top being a reversal pattern, but acting as a continuation pattern inside a trend:

Head and Shoulders

The head and shoulders pattern signals a weakening momentum where price cannot sustain a further push to the upside breaking the high and just drops through the previous swing low. The base created by the swing low (blue line) is called “the neckline” and once broken it “confirms” the validity of the H&S pattern. You are not obliged to wait for the neckline to be broken though, as when you have a solid reason to anticipate such a brake due to a fundamental catalyst or bias you can trade it before the breakout in anticipation of it occurring.
As we saw for the double top/bottom, a head and shoulders pattern can be used as a continuation pattern even if it is a reversal one in nature. Let’s see an example below:

Triangles

Triangles are continuation patterns but as we saw previously, patterns should always be viewed in context and not traded with mechanic rules. Triangles signal a consolidation due to indecision or lack of fundamental driver in the market. As you can see in the picture, they can break either side. Beware not to be too carried away by the price action when spotting triangles as they can be prone to spikes that look like false breaks.

Pennants

Pennants are a small version of symmetrical triangles, it’s more of a short-term consolidation type of pattern and generally it signals a continuation of the previous trend.

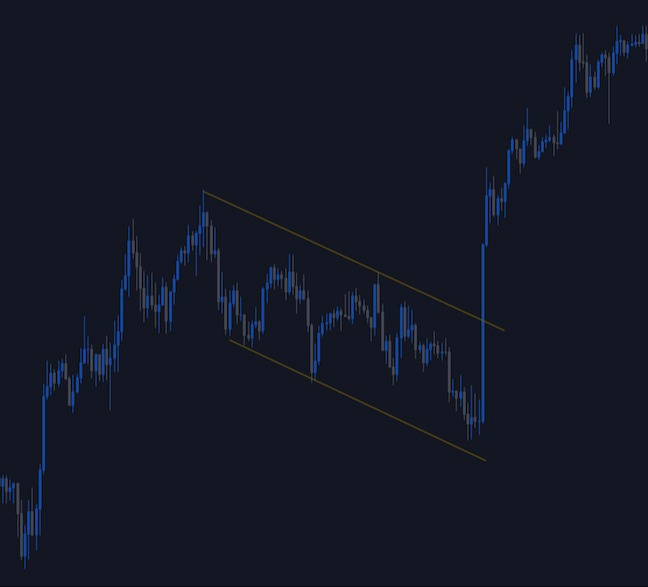
Flags

As for the pennants, flags are a short-term consolidation type of pattern and generally they signal a continuation of the underlying trend.
Wedges

They signal a weakening momentum with price due for a correction. They are considered a reversal pattern, but as we saw earlier reversal patterns can be used as continuation patterns. This pattern can give you some of the best entries in line with the general fundamental trend. Generally, price corrects to the base of the pattern and if the fundamentals support the move, price gets rejected from that same base, sometimes even perfectly. Take note also that even failed patterns can be useful, because they may tell you that there’s something bigger moving the market and you should be mindful about it.

Below an example of a failed wedge pattern that turns out to be meaningful:

There is another version of the wedge pattern called expanding wedge and it has the same properties as the wedge pattern.

Below you can see an example of a failed expanding wedge:

Always remember to trade chart patterns in line with the underlying sentiment or the general fundamental trend for the best results. This way of approaching your technical analysis may help you to filter bad trades and cut losses short instead of waiting to be stopped out for a full loss. Keep in mind capital preservation and select only assets and trades you have the most conviction in, because your job is not to trade, but to make money.
This article was written by Giuseppe Dellamotta.

