
1.3399 the new high and it looks like it wants to bust the level good and proper as the strength builds underneath.
The weekly candle is holding above the 200 wma and if it manages to close the week above that will be the first close above since August 2011
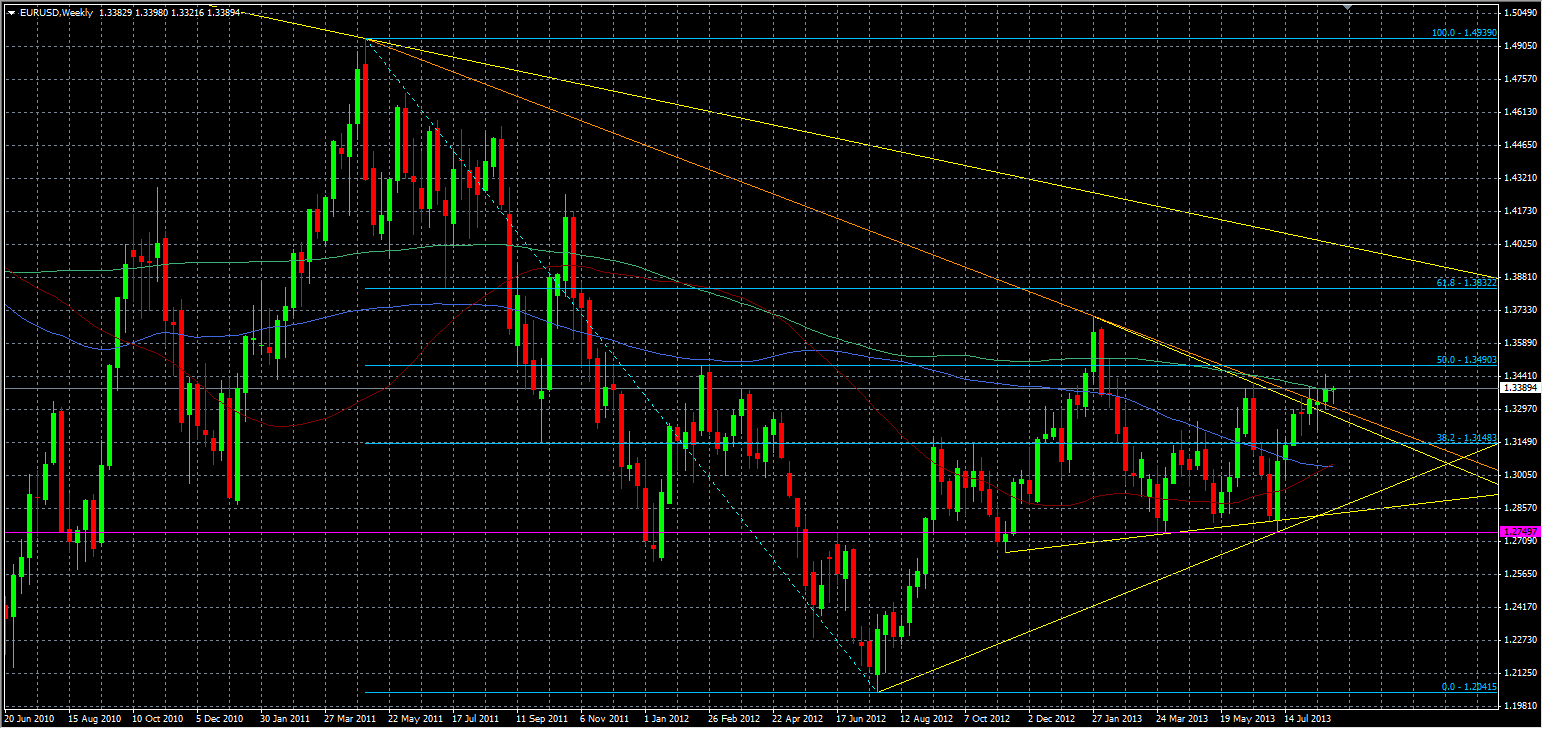
EUR/USD weekly chart 27 08 2013
Should we break 1.3400 then expect stops to lie in wait which could push us through resistance at 1.3409. After that there’s more at 1.3426/28 which contains the 100 mma. Then it’s 1.3454/60 which holds strong technical resistance and the 55 mma.

