
Is the reflation trade really dead?

If you take a look at commodities and commodity currencies , the peak of the trade came around mid-March. Energy has been an exception but that's a result of OPEC+ (oil) and hot weather (natural gas).
It's a similar story in equities where growth/tech re-took leadership from value/cyclicals around the same time.
One line of thinking, which I highlighted in Reuters interview this week is that there is a school of thought that you sell the recovery trade when the pace of growth peaks and that the pace of growth from Q3 onwards will decelerate.
I certainly wouldn't count myself in that school this time around as pandemic openings and closings skew the numbers.
Here are some reasons not to give up yet on reflation.
1) The reopening is only beginning
In Toronto, I still can't eat indoors. The US is ahead of the curve and the UK isn't far behind but virtually every other country in the world is in some form of lockdown. Just today, Tokyo went back into a state of emergency. Things continue to move backwards in Australia. Vaccination is ongoing at a rapid pace and the lack of corresponding higher hospitalizations with higher UK infections is a sign that the jabs work. Normal is coming but for most of the world, it's still months away.
2) The cash on the sidelines
I'm not talking about on the sidelines of the market, but on the sidelines of the global economy. Savings rates have shot higher during the pandemic and house-prices rises have fattened household net worth. Here's a chart showing how little Americans are spending on debt payments. Once the reopening advertising machine goes back to work, the credit card bills and HELOC loans will goose the economy.
It's been a rough start to H2 in equities but we've only just begun. The H1 gain in the S&P 500 was 14.6%. Since 1920, there have been 15 years of H1 gains of 10-20% equity gains. In 13 of those years, the second half was also positive and by an average in excess of 10%. The only two declining years were 1983 and 1986 and those declines were just 1.9% and 3.5%, respectively.
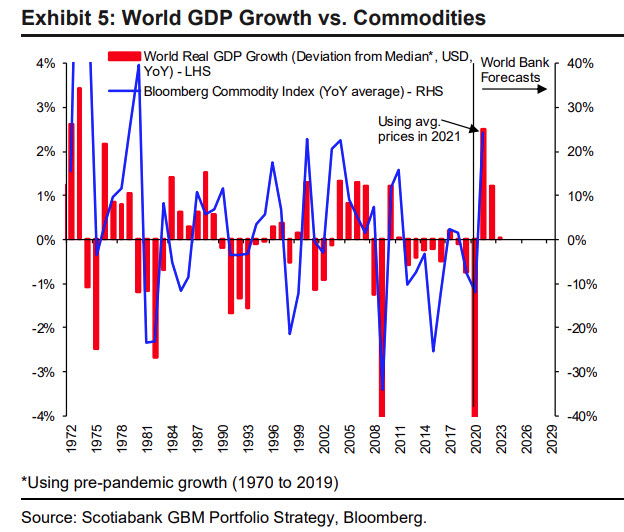
4) World GDP growth will beat its historical average over the next two to three years.
This Scotia chart highlights how commodity price gains strongly correlate with real GDP growth above median.
A similar correlation shows that the US dollar tends to weaken in times of above-median global growth.

