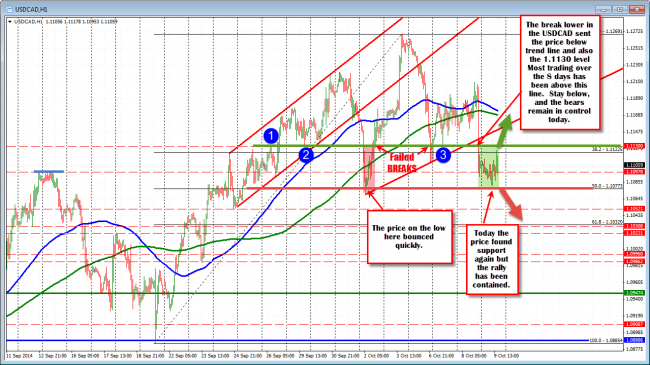
The USDCAD tumbled below 100 and 200 hour MA (blue and green lines), trend line support and the 1.1130 level. The significance?

The USDCAD is between a floor and a ceiling. Look for a break and momentum.
Looking at the hourly chart above, the 1.1130 area was near highs on Sept 24/25, it was near lows on Sept 29/30 and was a low on October 7th. There were two failed breaks below the level on October 2nd (the most significant as far as time and depth of the break) and again on Monday (more brief and less deep).
The price has been able to stay below the line post the intial FOMC meeting minute plunge. In trading today, the price extended up to high of 1.11247. Look for patient sellers against the level (with STOPS above).
On the downside there is it’s own support level. That comes in against the 50% level at the 1.10773. On the move lower last week, the price dipped below this line (at 1.10773) for one part of an hourly bar, only to find buyers who then squeezed the pair back up to the days high (the lap was completed SEE: USDCAD completes a lap and takes the checkered flag). The low today came in at 1.10808 – just above that level.
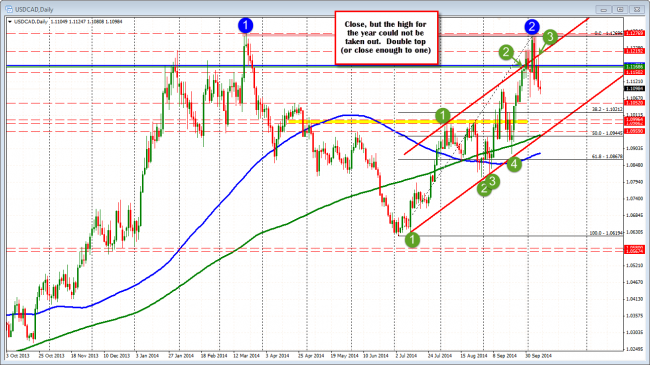
The daily chart is showing more downside corrective potential. The price last week, moved above channel resistance but could not take out the high from 2014 at the 1.1269 level. The 38.2% of the move higher comes in at the 1.10212. If the price can break below the support floor, this would be the corrective target.

The daily chart moved above the topside trend line last week, but could not get above the high.
The price sits between support and resistance with traders looking for the next break. The Employment statistic for Canada will be released tomorrow. The report does not share the day with the US jobs report, so there is the potential for the focus to be on the loonie. Traders might use the opportunity to follow the lead from that report.


