
It's hard to believe that it has only been a week since the dollar rout was triggered, as a result of a softer US CPI report. That kicked off a correction wave in dollar pairs but right now, we are seeing that momentum wane a fair bit upon meeting key technical levels.
A stronger US retail sales report yesterday did the dollar no harm but perhaps the technical aspect is also playing a role in limiting the next downside leg in the greenback for the time being. This checkpoint could also be a spot where dollar bulls may look to return to the fray, considering that the Fed continues to reaffirm that they will raise interest rates further until perhaps 5%.
At least for now, I'll let the technicals do the talking as we run through this checkpoint for the dollar.
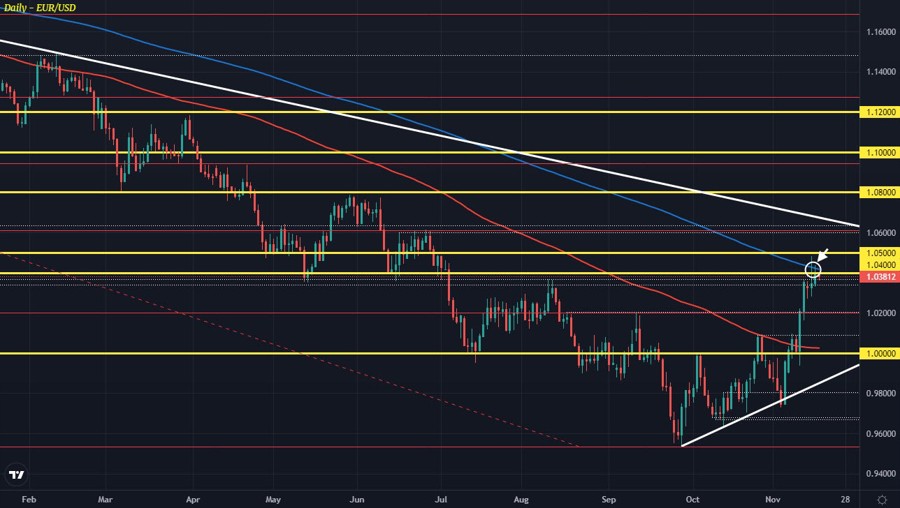
EUR/USD is stalling at its 200-day moving average (blue line) and that is the key level on the charts right now for the pair. Break above and buyers will be able to continue the upside momentum but keep below and sellers have reason to lean on that in search for a push back lower.
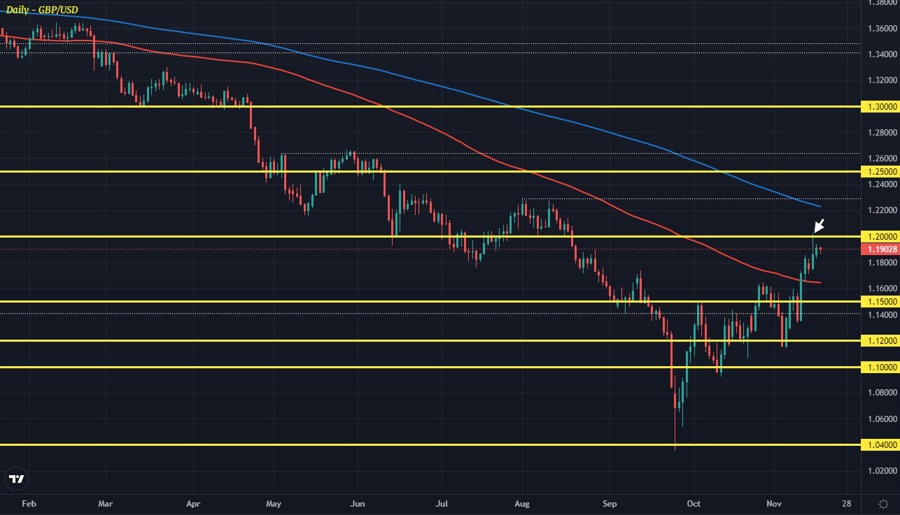
GBP/USD has shown much resilience since its late September lows, climbing back to touch 1.2000 earlier this week. The figure level though is a key resistance point on the daily chart, limiting any upside momentum before getting to the 200-day moving average (blue line), now seen at 1.2229.

USD/JPY has been an intriguing one after the drop below its own 100-day moving average and with sellers testing waters below 140.00. However, the pair is caught in a narrower channel in the past week in and around the figure level. Right now, sellers are starting to lose some steam with price starting to contest the 100-hour moving average (red line) again.
If buyers can push back above that, the near-term bias turns more neutral instead. The 100-day moving average at 140.89 will then be the next key level to watch in that regard.

USD/CAD has also seen a stirring drop in the past two weeks, in part also triggered by a stronger Canadian jobs report on 4 November. There was a bit of a push and pull around 1.3500 before the softer US CPI report last week provided the catalyst for a firmer breakdown, with the pair then running into its 100-day moving average (red line), now seen at 1.3243.
That is the key level to watch in determining any further downside momentum for the pair. Hold above and buyers are still in with a shot, especially now as price action moves back in between its key hourly moving averages of 1.3291 (100-hour) and 1.3381 (200-hour). That indicates that the near-term bias is now more neutral.

Then, we have AUD/USD which is seeing its recent upside run stall around the 61.8 Fib retracement level at 0.6767 on the daily chart. The break above the 100-day moving average (red line) was encouraging for buyers but now, the momentum is being challenged as equities are also starting to look a little shaky on the week.
The 100-day moving average at 0.6695 will be in focus as a break below that will invalidate buyers' resolve to keep the bullish momentum going. Additionally, we are seeing price action now start to encounter a bit of a tussle around the 100-hour moving average at 0.6716. Keep below that and the near-term bias will also stay more neutral with the 200-hour moving average only seen at 0.6595.

