The technical bias remains in the bulls/buyers court
The CADJPY has been on a tear to the upside since the September 20 low (Adam speaks to the fundamental of the CAD HERE).
Over a 22 day period, the price has risen over 800 pips, and with today's new high trades at the highest level since November 2015. Technically, the move to the upside took the price above its 100 day moving average on October 5. After consolidating above and below the 100 day moving average level on October 6, the price based against the moving average (on Oct 7), and over nine trading days has moved over 460 pips higher.the high price today reached 92.88.

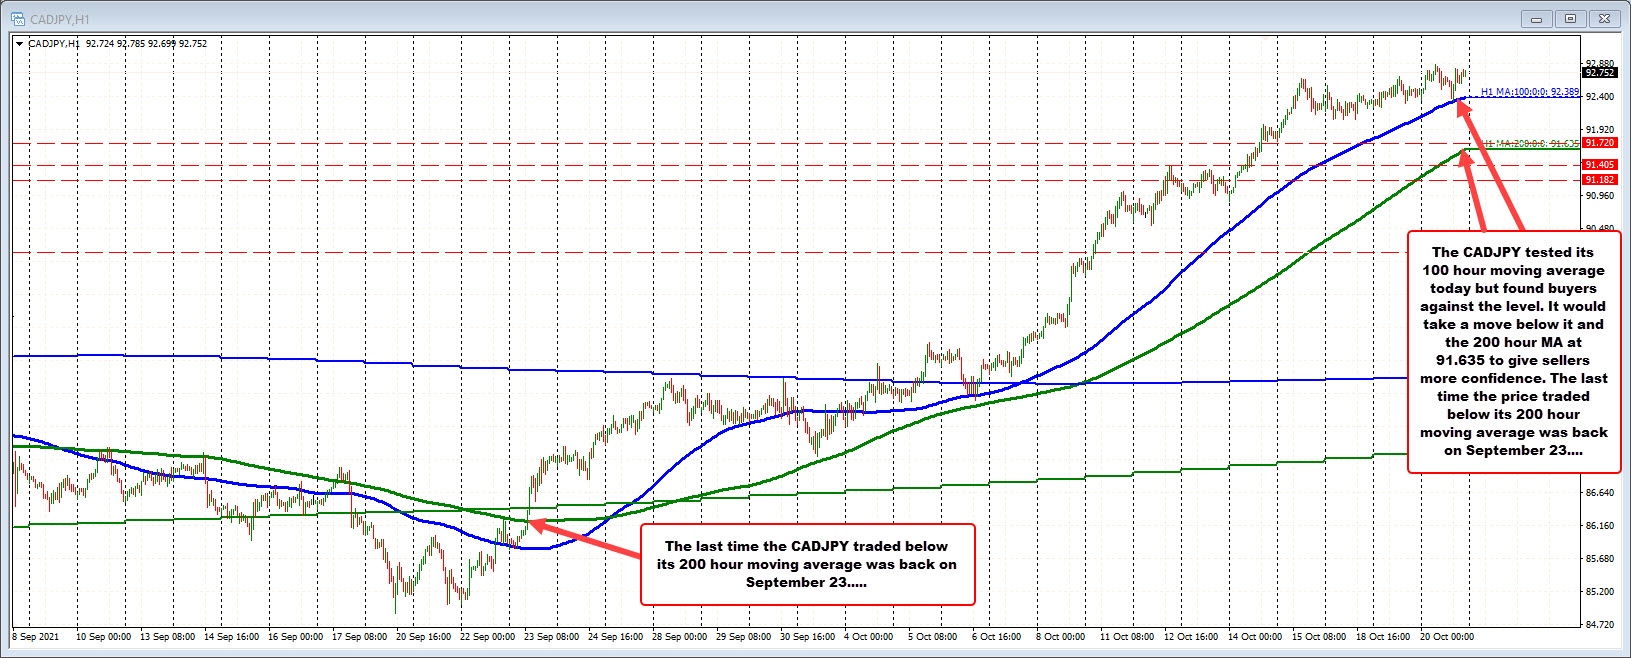
Drilling to the hourly chart below, the price rise has actually slowed down over the last four trading days(see chart below). That has allowed the 100 hour moving average (blue line) to catch up with the price.
The correction lower earlier today did see the price test the rising moving average line (see blue line in the chart below), but willing buyers leaned against the level and push the price back higher. The bulls remain in full control.
The current price is trading at 92.763. The 100 hour moving averages at 92.389.
For traders, the buyers remain in full control above the 100 hour moving average. It would take a move below that moving average to give the sellers the minimum control. Failure to do that and the buyers are simply NOT winning.
Although a move below the 100 hour moving average would give the sellers some control, it would still be the minimum. A move below the rising 200 hour moving average at 91.635 would still be needed to increase the bearish bias and confirm the tilt (at least in the short term). PS. The last time the CADJPY price traded below its 200 hour moving average was back on September 23. So a break would certainly be a "new development" for the pair.