
85.39 to 85.643 are the support target level
The CADJPY has moved sharply to the downside in trading today. The USDCAD has it trended to the upside and in the process has moved above the high from July taking the pair to the highest level since February. The move higher (lower CAD), has spilled over into the CADJPY as well (to the downside on a lower CAD).
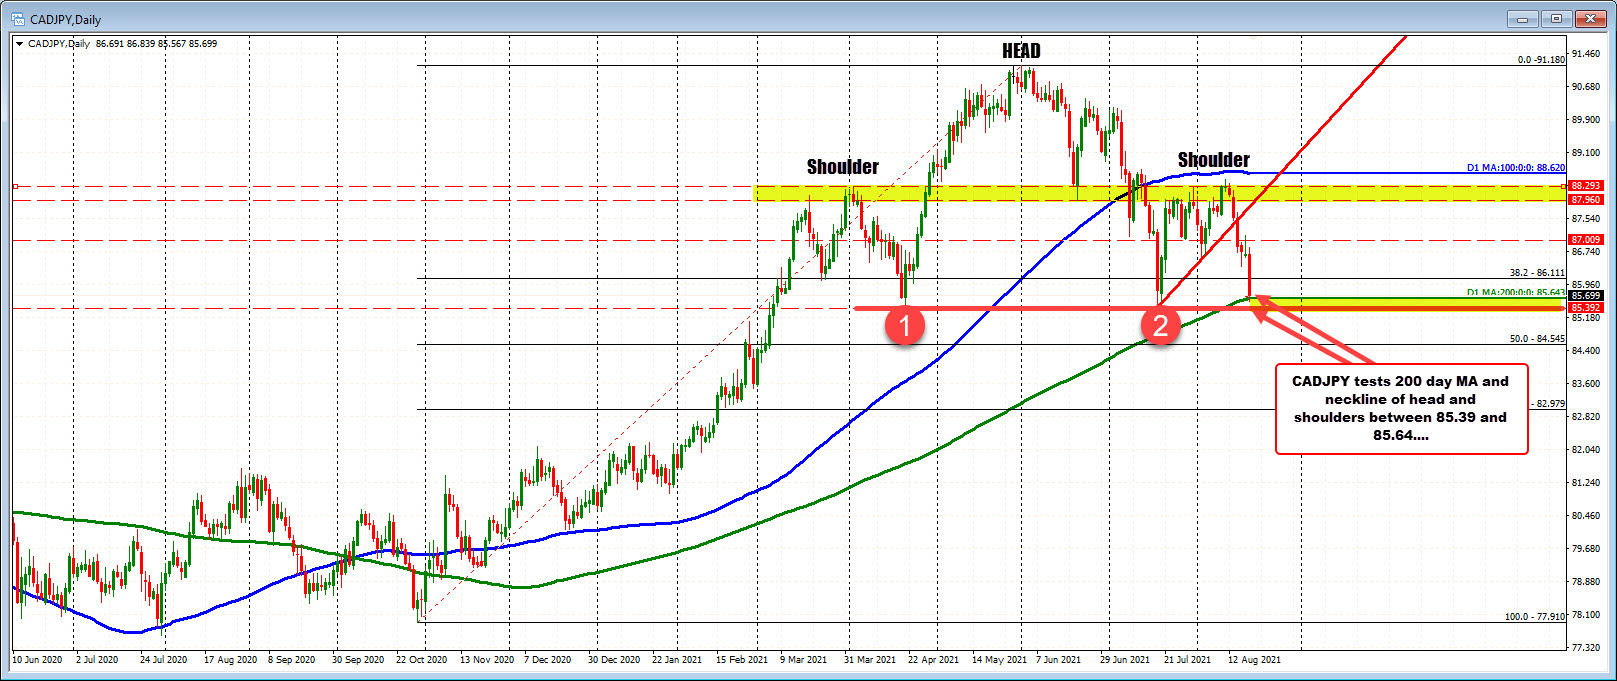
Looking at the daily chart above, the move to the downside has caught up with the rising 200 day moving average (green line in the chart above). That moving average currently comes in at 85.64. Also in play are the double lows from April and July at 85.39. Those lows create a nice sideways neckline of what looks like a fairly symmetrical head and shoulders formation.
A break below each of those levels would tilt the bias more to the downside from a technical perspective.
Having said that, just because a head and shoulders neckline is broken does not necessarily mean it works all time. There are plenty of failed breaks that look as symmetrical as this formation in this pair.
Nevertheless, breaking through a double bottom/neckline (and moving below the 200 day moving average as well), is a the bearish development.
It hasn't happened yet. The pair could easily bounce off of the dual technical support level. However, it is something to be aware of going forward.

