A rundown of some of the sore spots
The charts aren't always right but they should never be ignored, especially when so many dominoes are falling together -- and just six weeks after the bottom began falling out of Treasury yields.
There are still many risk-positive charts out there and many more that are hanging by a thread (EUR/USD is one). These ones are the most-worrisome:
1) WTI Crude Oil
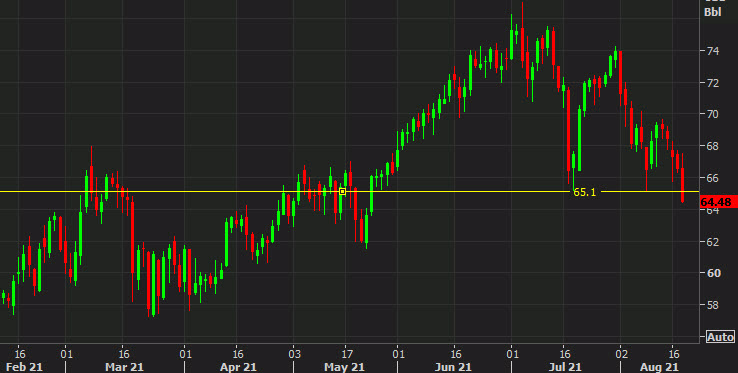
Little has changed in the supply picture since OPEC firmed up its agreement so I think it's safe to say the latest drop in crude is all about demand worries. Today WTI broke through a double bottom at $65.00 to the lowest since May.
2) AUD/JPY
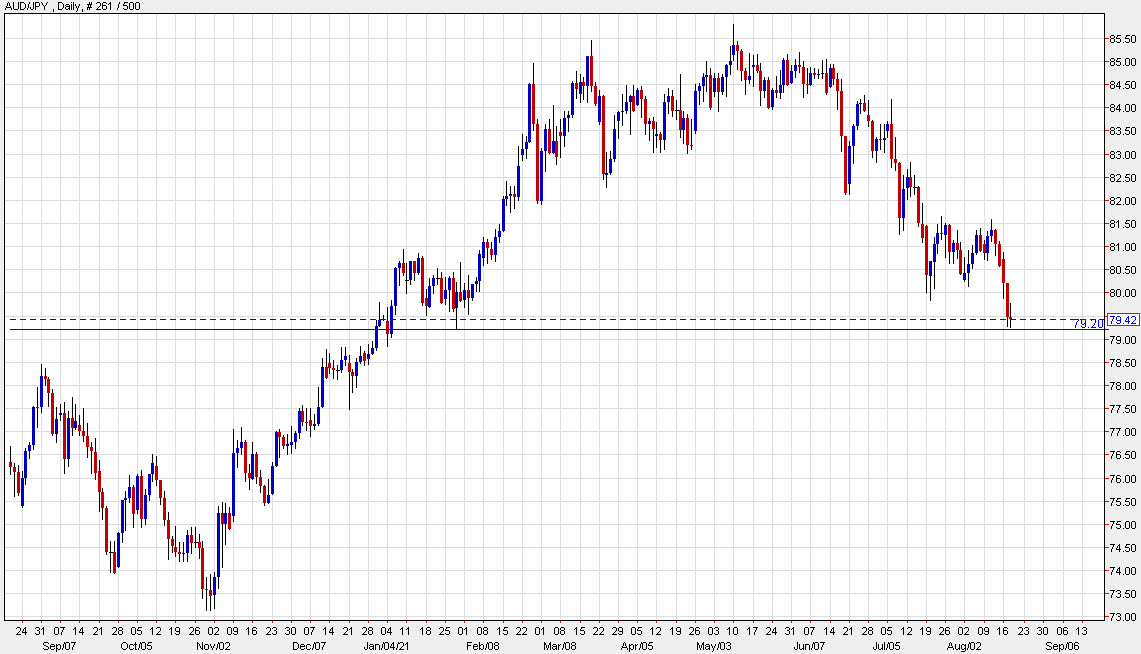
AUD/JPY is a classic rick trade proxy and it's not telling a great story at the moment. Delta has broken down pandemic safety measures all over and nowhere is that more clear than in Australia, where the great success in the first year of the pandemic has given way to lockdowns and a strategy of total suppression that appear doomed.
This week AUD/JPY broke the July lows and is now threatening the lows of the year. If those levels give way, then support is increasingly scant. Note that the July Australian employment report is due at 0130 GMT.
3) NZD/USD
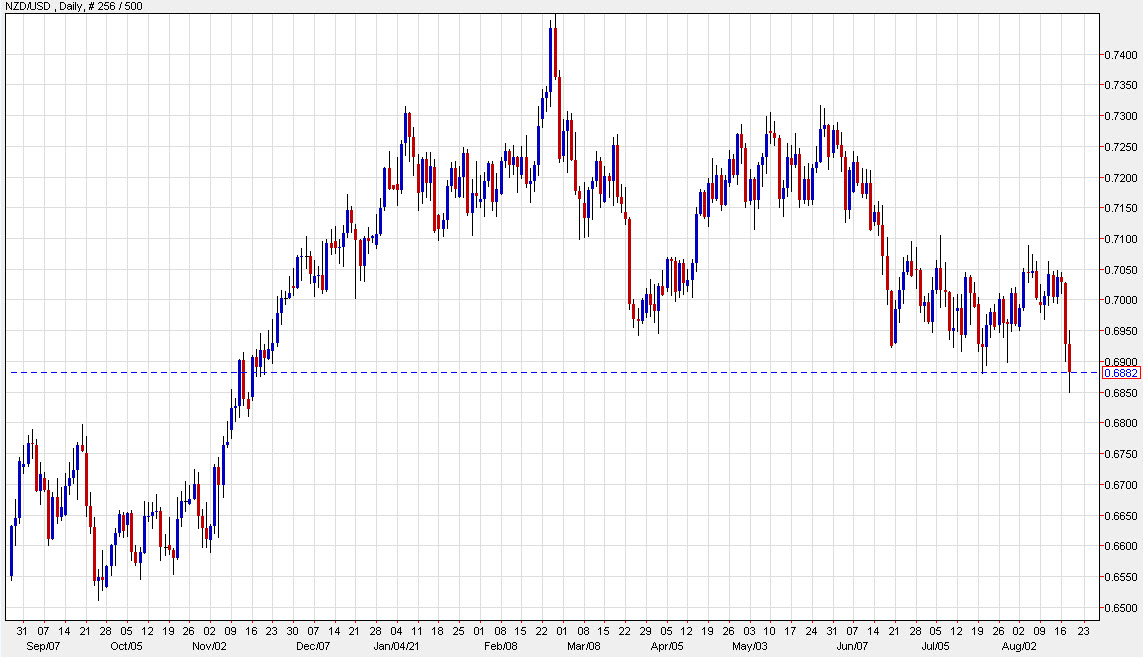
The New Zealand dollar has been the focus of trading this week after the outbreak and surprise RBNZ decision to hold rates. An upbeat performance from Orr yesterday despite holding rates gave the kiwi a lift but souring sentiment globally unwound the bounce and NZD/USD closed right at the July low.
The good news is that the bad news is already out in the open. The lockdown is ongoing and the rate decision is over. That was a big blow to the bulls but they haven't capitulated.... at least not yet. We'll be watching carefully for signs of more covid cases today and for the remainder of the month.
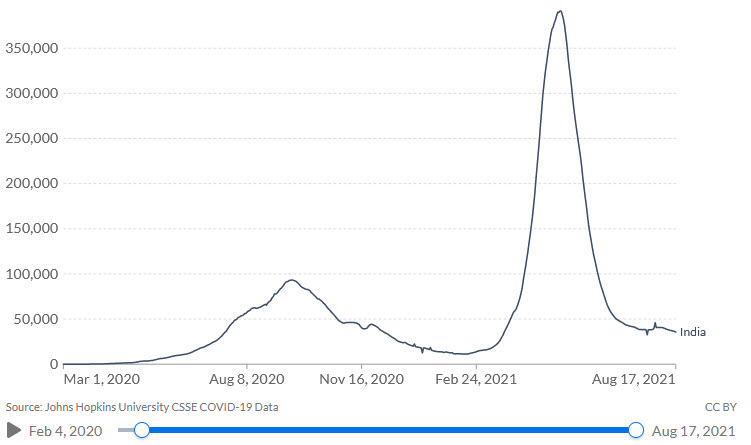
The best hope for the bulls is that the covid charts in the US and elsewhere starts to look more like India, where the delta strain was first identified: