
Does not go negative today
The USDJPY was a big gainer on Friday after the Fed comments from Jackson Hole and the door being left open for September.
Looking at the daily chart below, the price took off from a low of 100.05. The high extended to 101.936 before closing at 101.78.
Over the weekend Kuroda said the BOJ would do all it could to advance the economy/inflation. The pair opened higher (see 5-minute chart below), corrected lower, but stayed above the closing level. The low could only get to 101.825. The correction off the high has come downt to around the 50% of the move higher today. Buyers stay in control although admittedly, the market is trading like it is a holiday in the US too (London traders ARE on holiday today of course)....

Taking a broader view (for the rest of the week), looking at the hourly chart, the price move higher on Friday ticked off level after level. Topside triangle trend lines (two of them) were broken. The 100 and 200 hour MAs and the 100 bar MA on the 4-hour chart. The next targets on the topside come in against the high from August 5 at the 102.649 and the August high at 102.928. The 200 bar MA on the 4-hour chart come between those two extremes at the 102.723 level. That area should give cause for pause, but a break opens up further upside potential.

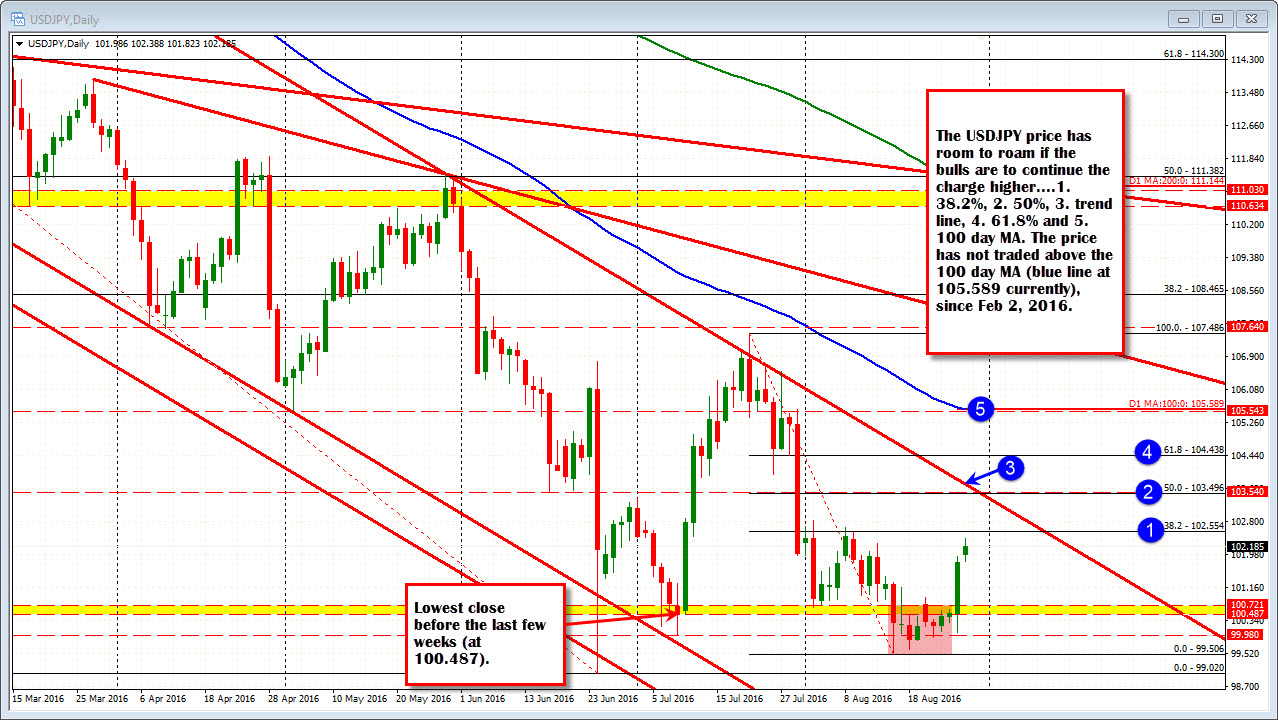
Where can the price go if the bulls continue to push higher?
Going back to the daily chart, the 50% of the move down from the July high comes in at 103.496. That is just the minimum correction of the last leg lower this year. Trend line resistance (the break failed in July), the 61.8% and the 100 day MA at 105.589 are all doable targets. The price has not traded above the 100 day MA since Feb 2, 2016 when it broke below at the 120.594 level. That was a long time (and many big figures ago).
So there is room to roam.
Can we correct? Of course we can. If we do, close support at 102.10.
Below that 101.78-82 will be eyed (close from last week/low from today).

