Buyers have little luck pushing higher so far...
When looking at the future, it helps to look at the past. Doing so can help dig into the soul of the traders who are pushing the market one way or the other.

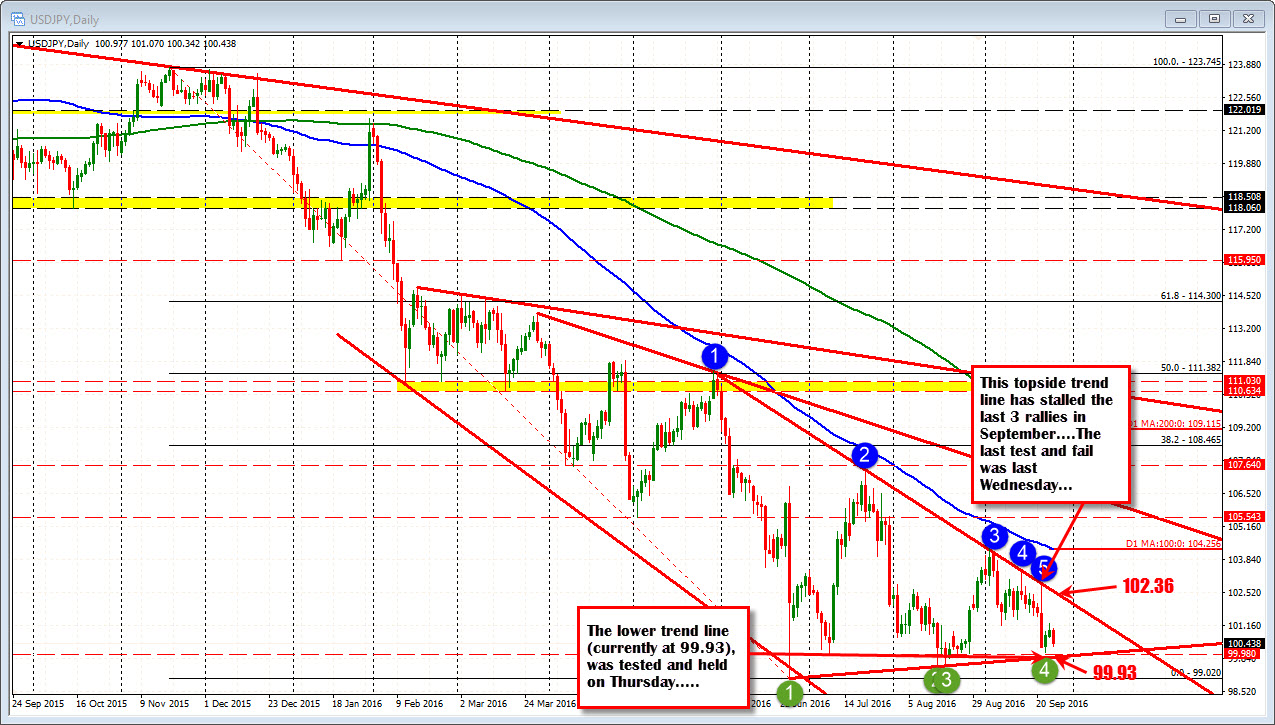
When I look at the daily chart of the USDJPY, I see the pair finding sellers against a topside trend line not one, not twice by three separate time this month alone. The last test was at the highs last week (on Wednesday). Sellers leaned. The buyers failed. That line has 5 different points on it (see blue circles in the chart above).
Holding that line led to a move lower and on Thursday, a lower trend line was tested (see green circle 4) and that line also found traders leaning. This time on the buy side. The line currently comes in at 0.9993. The low today extended to 100.34 - still nearly 40 pips away from the level.
So the daily chart is showing a converging range between a declining topside trend line currently at 102.36 (and moving lower each day), and a rising trend line at 99.93 (and rising each day). Sellers and buyers are leaning against each of the line.
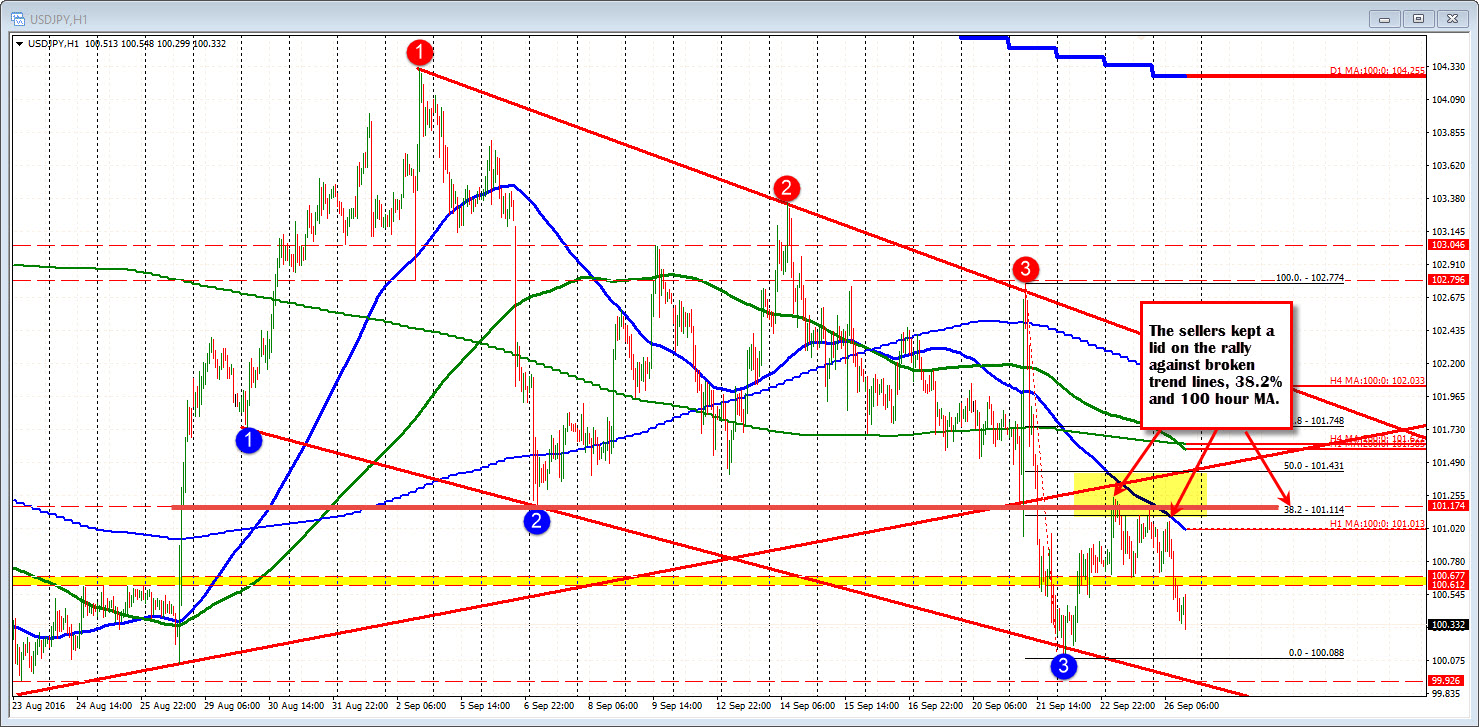
Drilling down, to the hourly chart, the rally off the lows last week. stalled against near the low from September 6th at 101.174, the 38.2% at 101.114m and below the 100 hour MA (blue line). That is more bearish. The high today could not get above the 100 hour MA. That MA (blue line at 101.013) is a risk defining level for shorts now. Stay below is more bearish.
So of note is the 100.61-677 area. This area capped the market back on August 24-26 and was a floor in trading on Friday. Today, the price fell below that yellow area (more bearish). Stay below this level and the sellers target the low from last week at 100.088 and the lower trend line connecting recent lows at 99.93 (same level off the daily charts trend line).

Sellers are in control below 100.61-677 with other topside resistance up to the 100 hour MA at 101.01. There is decent support at the 99.93 area.


