
The USDJPY rallied strongly earlier today, rising from 118.089 to 119.30 in a 5 hour window. The move higher took the price above the 50% of the move down last week at 119.01. It moved back above broken trend line at 119.05 and the 100 hour MA at the 119.10 level. The market was flying.
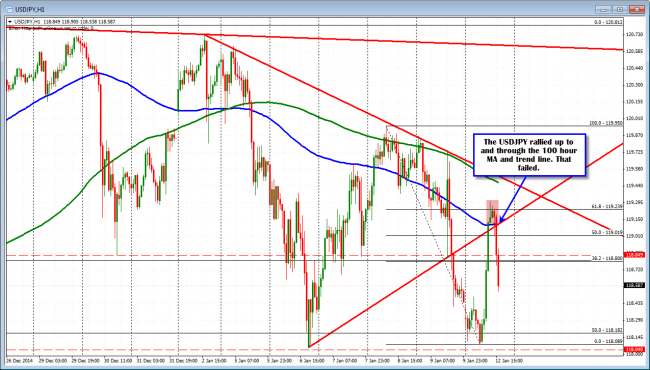
USDJPY rallied above the 100 hour MA and trend line resistance as well.
That did not last. The price started to take back what it took. The 100 hour MA was broken. Then the 50% level at 119.019.
Looking at the 5 minute chart, the 100 bar MA (blue line in the chart below), put up a fight to hold support against that level, but that was broken. The 50% of the move up today was also broken at 118.697. These levels should not have been broken. They should have held support. This is not the way price action is supposed to be. The strong rally higher today, should have kept the bid.
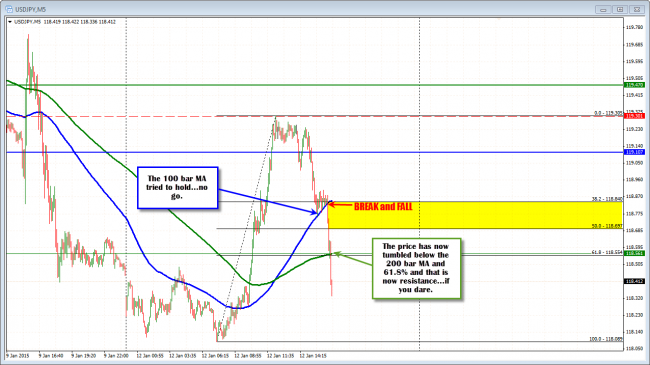
USDJPY on 5 minute chart showed buying, buying and buying and now selling, selling and selling.
When the market does not what you expect – or should – it is best to step aside.
The USDJPY is on it’s way toward taking a full lap of the move higher today. The 118.554 is now resistance, if you want to enter the street fight. Stocks are taking it on the chin and the trade from last week – buy the JPY as stocks tumble seems to be the Pavlovian reaction. A quick look at the daily chart is showing the bearishness as well. But remember, street fights can be brutal so be patient and look for opportunities against risk levels (i.e. the price should find sellers against the 118.55-69 area now). Careful.
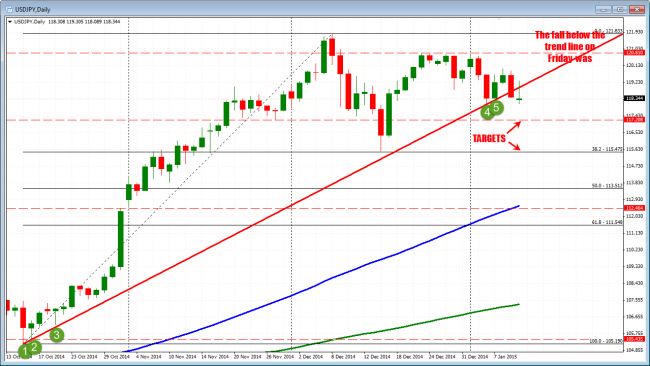
The USDJPY daily chart.

