
200 bar MA on 4 hour chart and 100 day MA at 1.2889.
The GBPUSD has had an up and down and up again day today. The current bar moved to a new session high at 1.28857. The problem for the buyers is that the pair is running smack into the 100 day MA and the 200 bar MA on the 4-hour chart at 1.28896 (blue and green step line overlayed on the hourly chart below).
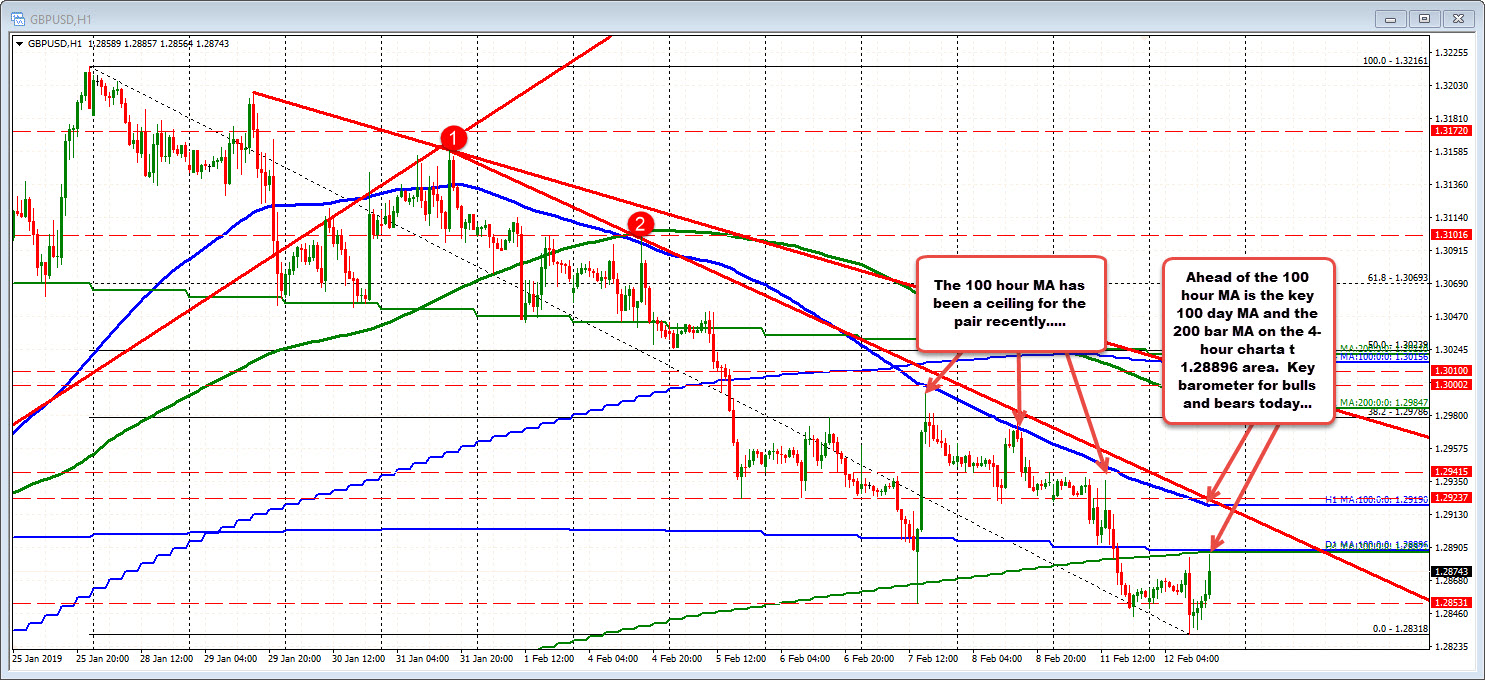
Yesterday the price fell below each, tilting the technical bias to the downside. For risk focused traders, the level will be a key barometer for the bulls and bears. Stay below is more bearish. Selers can lean with stops on a break above. Move above, and the bias shifts back to the bullish side as the break below yesterday....fails.
On a move above, the 100 hour MA at 1.2919 and a topside trend line at 1.29237 become the next targets to get to and through.
On the downside, the low from last week reached 1.28531 That and the low for the day at 1.28318
Drilling to the 5 minute chart, the 100 and 200 bar MAs dissect the range to day at 1.2858-60 area. If the 100 day MA holds above, a move below those MAs would also tilt the intraday bais back to the downside for the pair (intraday).


