
Midpoint comes in at 1.37921. Swing area between 1.3790 and the 200 day moving average at 1.38043
The GBP is extending back toward the midpoint of the range since the July 30 high. That level comes in at 1.37921. The high price just reached 1.3790.
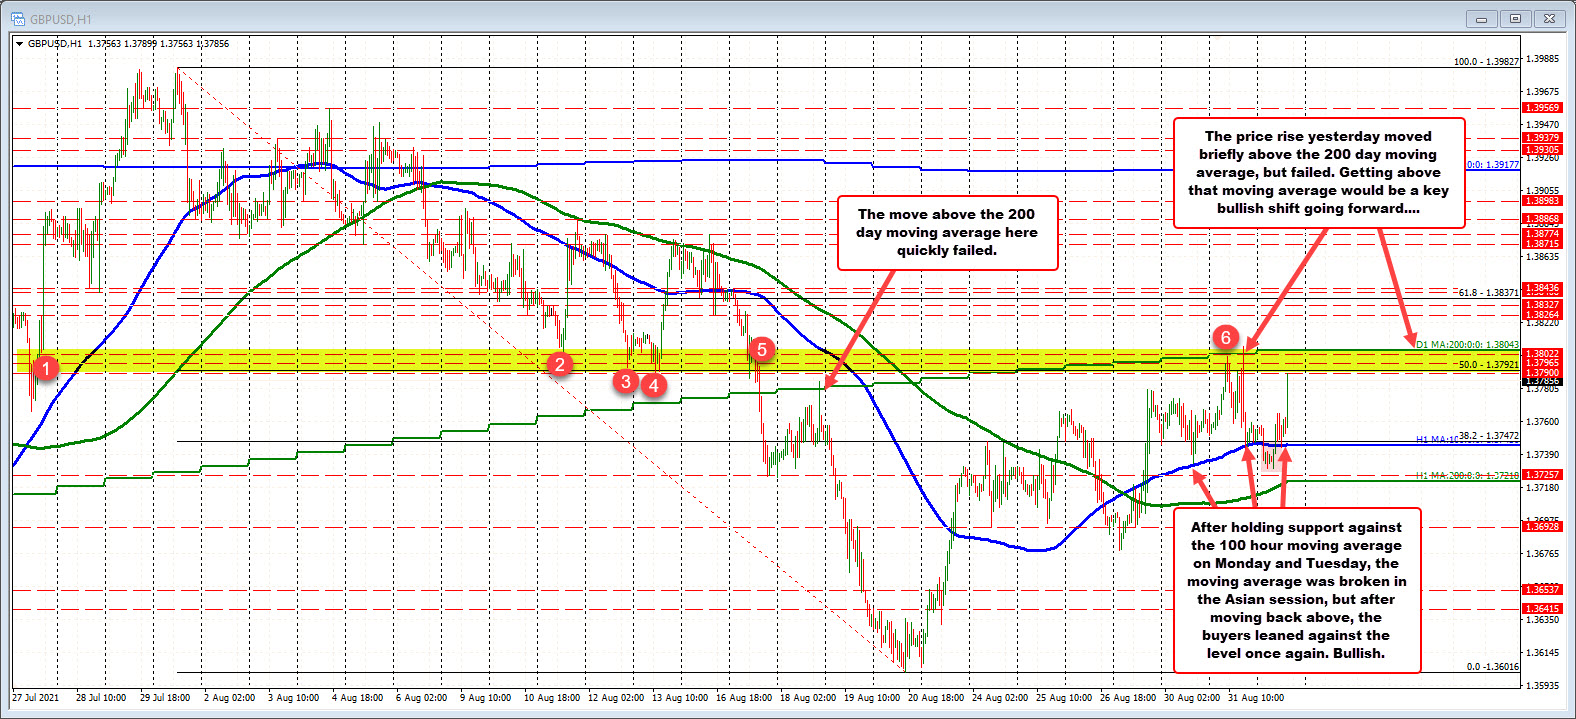
That high also reached the low of a swing area starting at 1.3790 and a topside resistance target at the 200 day moving average at 1.38043 (see red numbered circles).
Yesterday the price moved that swing area and in doing so also above the 200 day moving average for the first time since a similar break on August 18. Just like August 18, the price quickly reversed back to the downside after the failed break.
Getting above the 200 day moving average - and staying above - would be a bullish shift for the pair today/going forward.
Setting up the gain today was the basing against the 100 hour moving average and 38.2% retracement near 1.3745.
In the Asian session, the price move back below the 100 hour moving average after successfully testing it on Monday and Tuesday. However the downside momentum after the break could not be sustained, and the price moved back above the moving average level.
Finding support buyers against that moving average in the London morning session was a clue for the buyers to push the pair higher from a technical perspective.
Buyers are in control but overhead resistance looms.

