The pair has corrected but the buyers still have a lot to prove
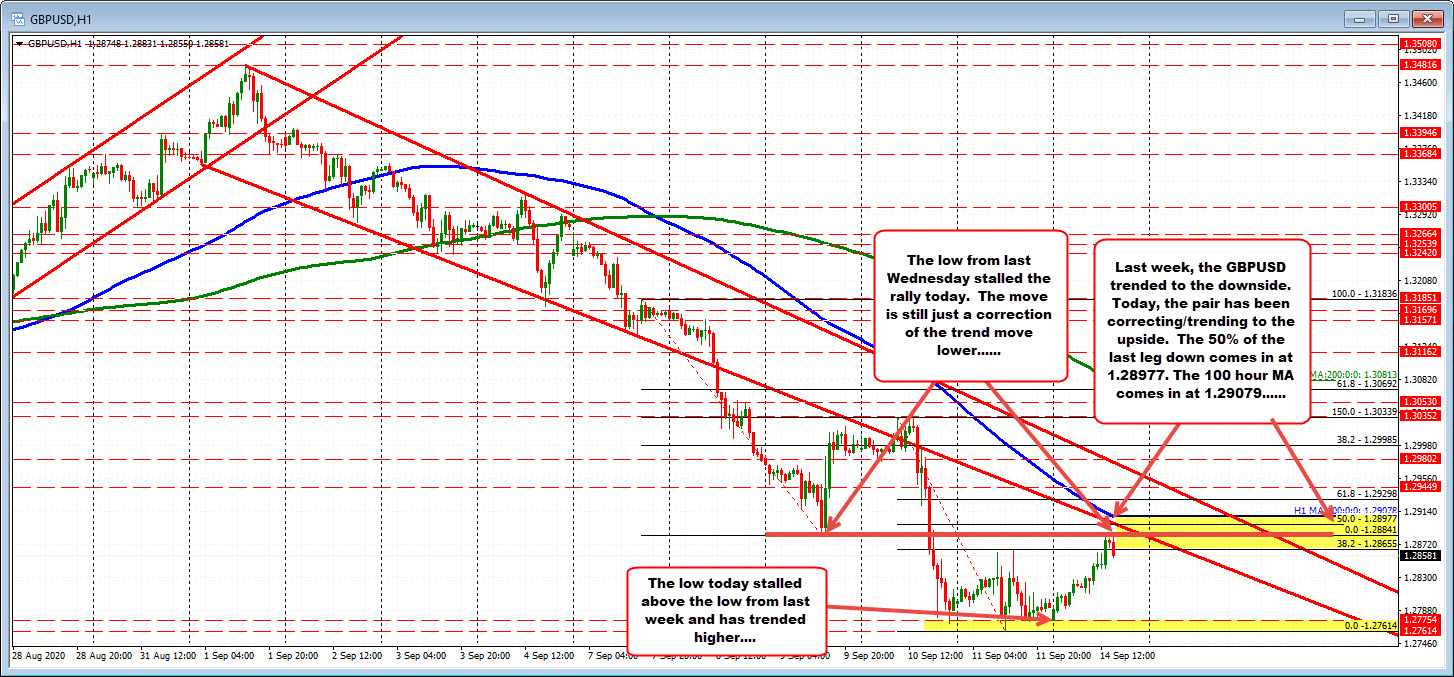
The GBPUSD as corrected higher after last week's tumble lower (see post here) saw the pair move down nearly 500 pips. The pair opened lower on the day, but started to move higher. The pair has seen the price move from a low of 1.2776 to a high of 1.2883. That level was just short of the low from last Wednesday's trading at 1.28841. That level has so far paused the rally. The current price trades at 1.2857
Although higher, the buyers has a lot to prove.
Looking at the hourly chart, the last trend move to the downside started on Thursday near 1.3033. The 38.2% to 50% retracement area comes between 1.28655 and 1.28977. The price rise has stalled within that "correction zone" . If the buyers cannot extend above the 50% midpoint of the last leg down, they are not winning. The sellers still remain in control.
Also in play is the falling 100 hour moving average. It currently comes in at 1.29078 (and moving lower). The price last traded above that level on September 3. It would take a move above that level to give the buyers more control.
So although, the buyers are making a play today, the move is so far just a correction in a premarket. Get above the 1.28977 level and then the 100 hour moving average at 1.29078 and buyers with take more control.
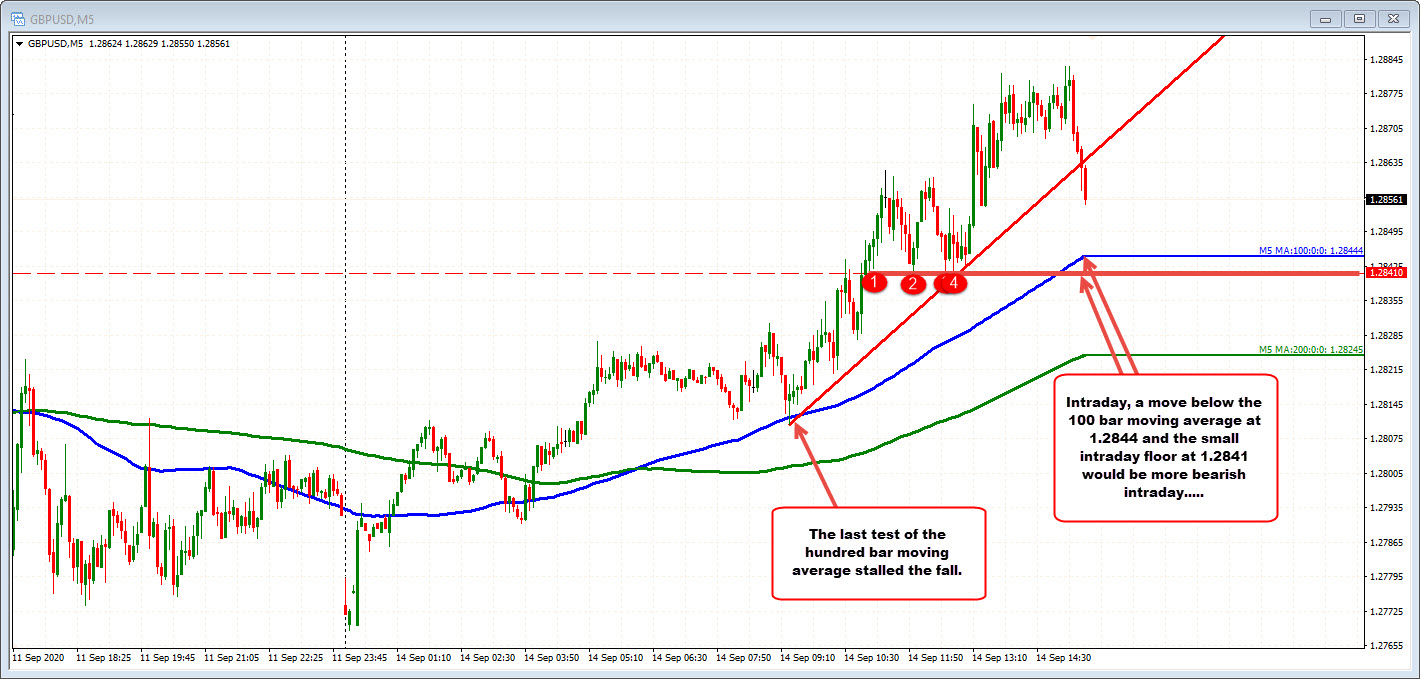
Drilling down to the 5 minutes chart, the price has moved below a rising trend line from the European morning session. The rising 100 bar moving average comes in at 1.28444. A move below the 100 bar moving average would be eyed as a intraday tilt to the downside.