
Head and shoulders patterns don't always work out
Beware of textbook chart patterns.
Charts that are nearly 'perfect' have a habit of not working out.
Last week I highlighted a potential head and shoudlers top in CAD/JPY, which had been one of the best trades in FX this year.
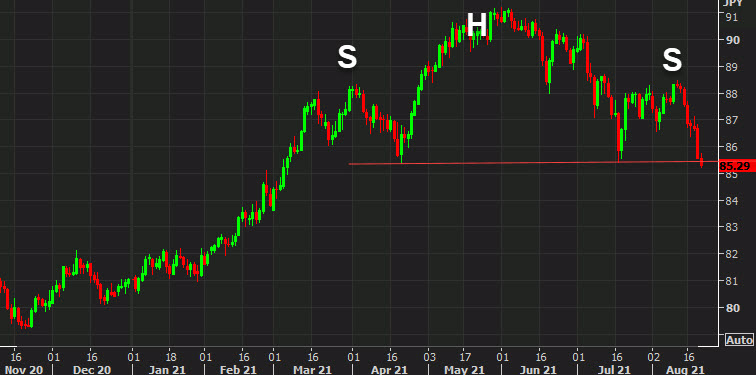
I even warned in the post that the "chart is almost too textbook".
What happened? It spun around in a hurry. After spiking lower the following day it pulled off an intraday reversal and has since jumped higher.
The story is similar in copper, which is back up to $4.23/lb after falling to $3.95 in Thursday's trade.
Was there any way of seeing it coming? For me this is a great example of why the fundamentals are so important. Even as I was writing about the charts, I didn't believe we'd see a breakdown.
Counter to the charts, I think we're going to get past delta. Highly vaccinated places are seeing a reversal in cases and even in hard hit parts of the US, there's a loss of momentum.
The trick was trading it and I think the two big clues at the end of last week were that intraday reversal along with the Fed's Kaplan expressing doubts on a September taper.

