
Lots of ups and downs
The USDCAD has fallen today. USD selling on the CPI sent the pair lower.

Technically, the pair in the Asian session moved above the 200 bar MA on the 4-hour chart, but stalled (see green step line currently at 1.27276). The up and down price action in the NY session has taken the price above and below its 100 hour MA (blue line at 1.2696 currently). The move back below the 100 hour MA today is the first break below since August 1st and the last few hours has seen the price stay below. The MA is close risk now. A higher risk level is the underside of the broken trend line and the falling 200 bar MA on the 4-hour chart.
Staying on the hourly chart above, the low today stalled right at the lows from Tuesday at 1.2652 area. That area was a strong base/floor on Tuesday. So although there is some reasons for sellers to put a toe in the water, getting back below the the 1.2652 level needs to be busted to get USDCAD selling back in vogue.
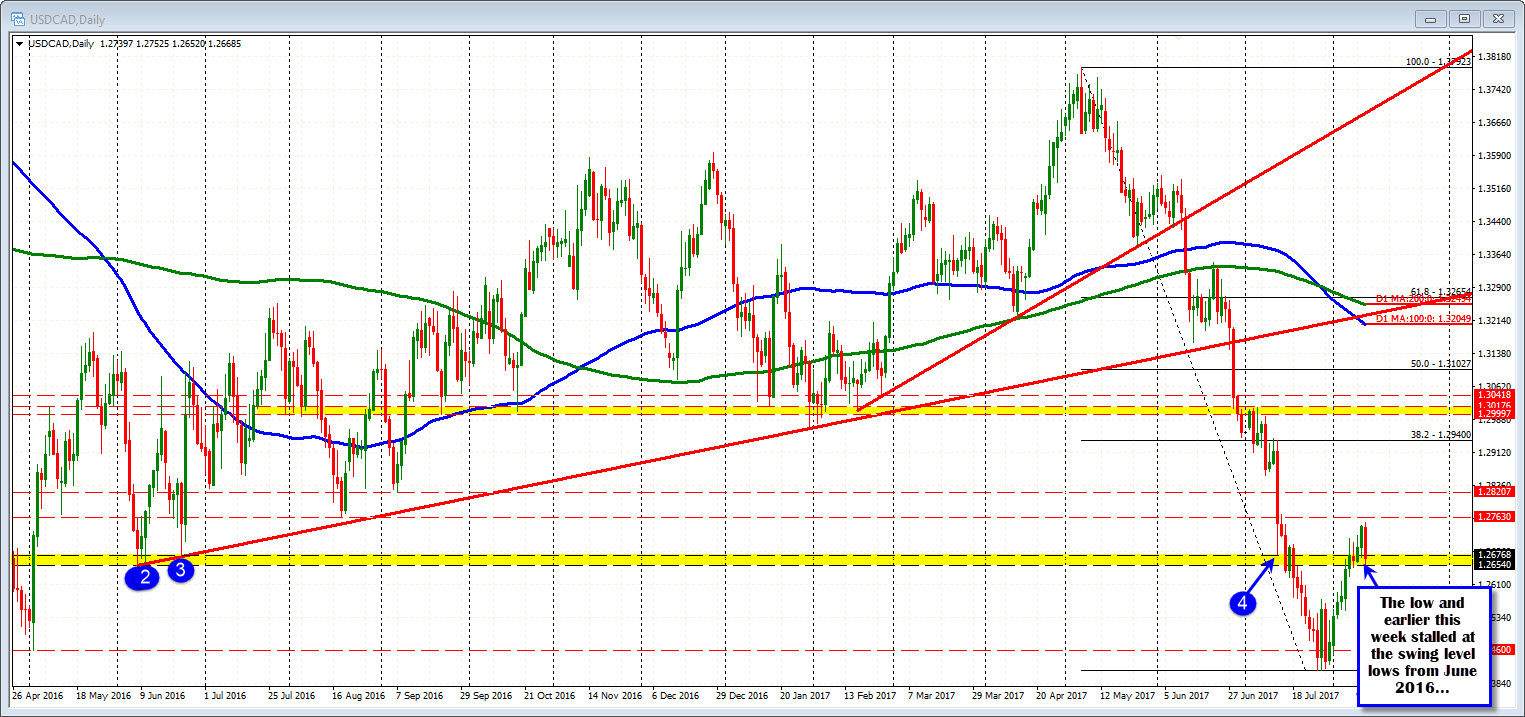
If I were to take a broader view from the daily chart (see chart below), you can see the importance of the 1.2652 level from the longer term chart.
Going back to June 2016, the swing low stalled at 1.2654. Another low in that month stalled at 1.26768. That area (lower yellow area in the chart below) is another reason why it needs to be busted to get selling back in vogue. We currently trade in that yellow area (between 1.2654-768).
SUMMARY: It might not be until next week, but the battle lines are set for the USDCAD. This week the upside was extended the corrective ranges, but there has been damage today that puts the correction in doubt. Nevertheless, there is work to do for the sellers. Specifically, get and stay below the 1.2652-54 level. Do that, and the selling/bearishness is back in vogue.
Fail and the buyers should take the price higher with a move above the 200 bar MA on the 4-hour chart a catalyst for more upside.

