
Price bounces near lower swing area yesterday/today.
The USDCAD price action over the last seven trading days has uncanny symmetry. The price started the rise to the upside back on August 17 after breaking above a swing area between 1.2580 and 1.2596.
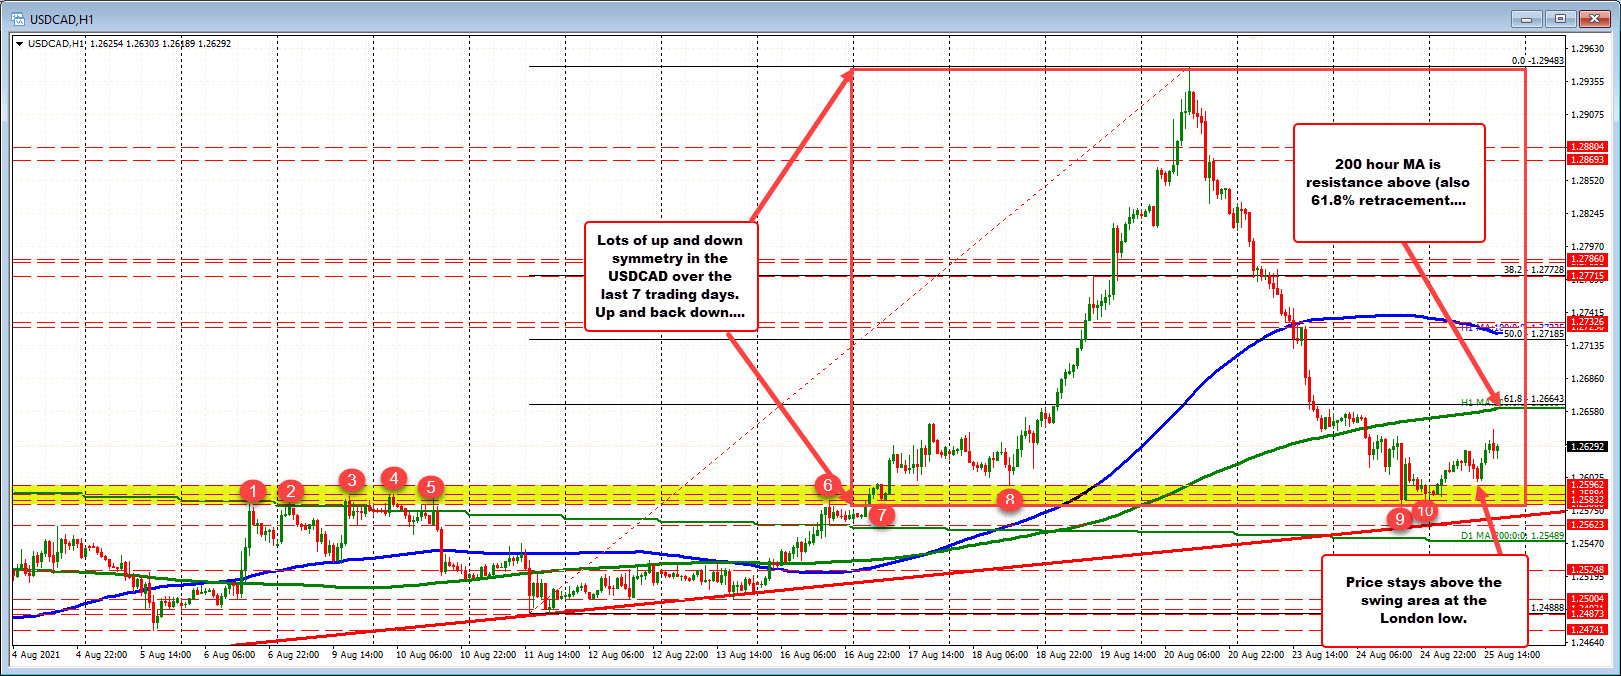
The next 3 1/2 days saw the price spite higher with the pair peaking on the 12th hour on August 20 (right in the middle of the trading day.
The next 3 days has seen the price return back to the lower swing area from August 17. The low price from yesterday dip just below the 1.2580 level to 1.25778 before bouncing.
What now?
Some may see a head and shoulders, although the shoulders kind of small. Nevertheless, breaking below the 1.2580 level with more momentum should lead to lower levels with the rising trend line at 1.2571 followed by the 200 day moving average 1.25489 as the next downside targets to get to and through. Wondering down to the August 11 low near 1.2488 would be the symmetrical move/target level (complete the full lap up and back down).
If those levels cannot be broken broken, the 200 hour moving average at 1.2663 and the broken 61.8% retracement just above that level at 1.26643 would ruin the bears/sellers ideas and tilt the bias a little more into the neutral/bullish area on the failed break.

