
Sellers leaned against the 200 hour moving average at the session highs
The USDCAD moved sharply lower on August 20 August 23 and August 24. The price move took the pairs price from a high of 1.29483 to a low of 1.25778. The declines mirrored the rise a few days before that sharp fall.
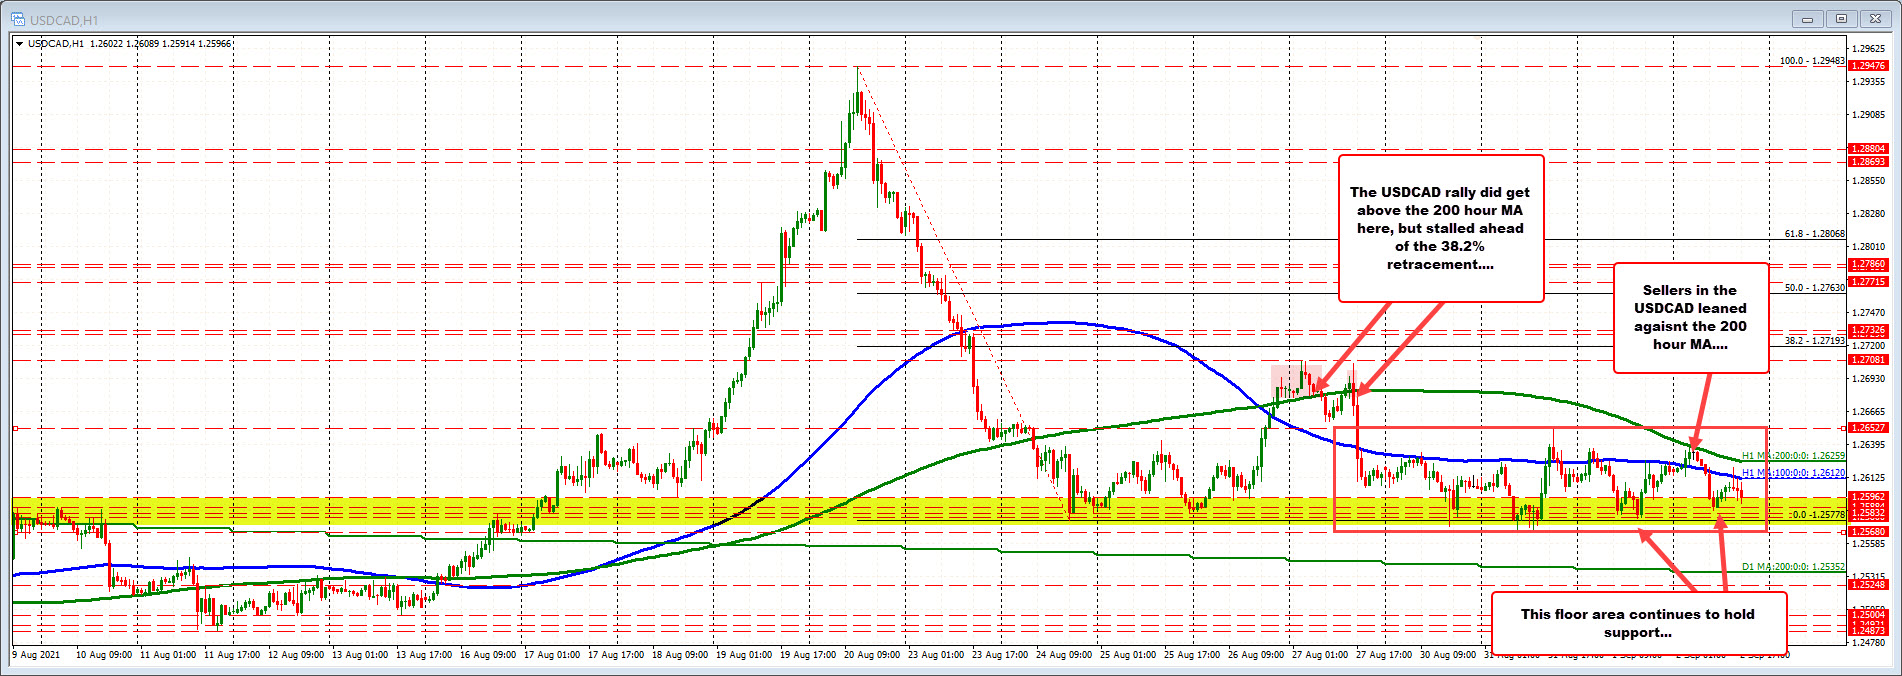
Since bottoming on August 24, the pair did see a snapback rally on August 26 that saw the price move back above its 100 and 200 hour moving averages (blue and green lines in the chart above) and up to a high near 1.2708. That high was still short of the 38.2% retracement of the move to the downside (at 1.27193). If the price is going to rebound, getting above the moving averages and the 38.2% retracement are minimum requirements. That did not happen.
On that same day, the price fell back below its 200 and 100 hour moving average (on the disappointment).
Since then, the USDCAD pair has moved sideways in a 84 pip trading range over the last four trading days. During that time, the pair did move below the swing low from August 24 at 1.25778. The lowest level came in at 1.2568. The price also moved above and below its 100 hour moving average (blue line in the chart above).
What did not happen is a move above its 200 hour moving average. That moving average has been moving steadily to the downside.
Today the initial move to the upside saw the high price move above the 100 hour moving average again. This time the price ran into its falling 200 hour moving average (green line). Sellers leaned against the level and pushed price back down toward the floor support.
The inability to move above the 200 hour moving average keeps the sellers more in control. Having said that getting below the floor and the low for the week at 1.2568 is still required. The battle continues with narrowing support and resistance. However, sellers remain more in control.

