
Up and down trading range over the last 12 days
The USDCHF has seen up-and-down price action over the last 12 trading days (see red box).
That volatility has seen the price remain within a fairly narrow 107 pip trading range. Between the extremes sits the 100 and 200 hour moving averages (blue and green lines) which are near converged at 0.9153 area.
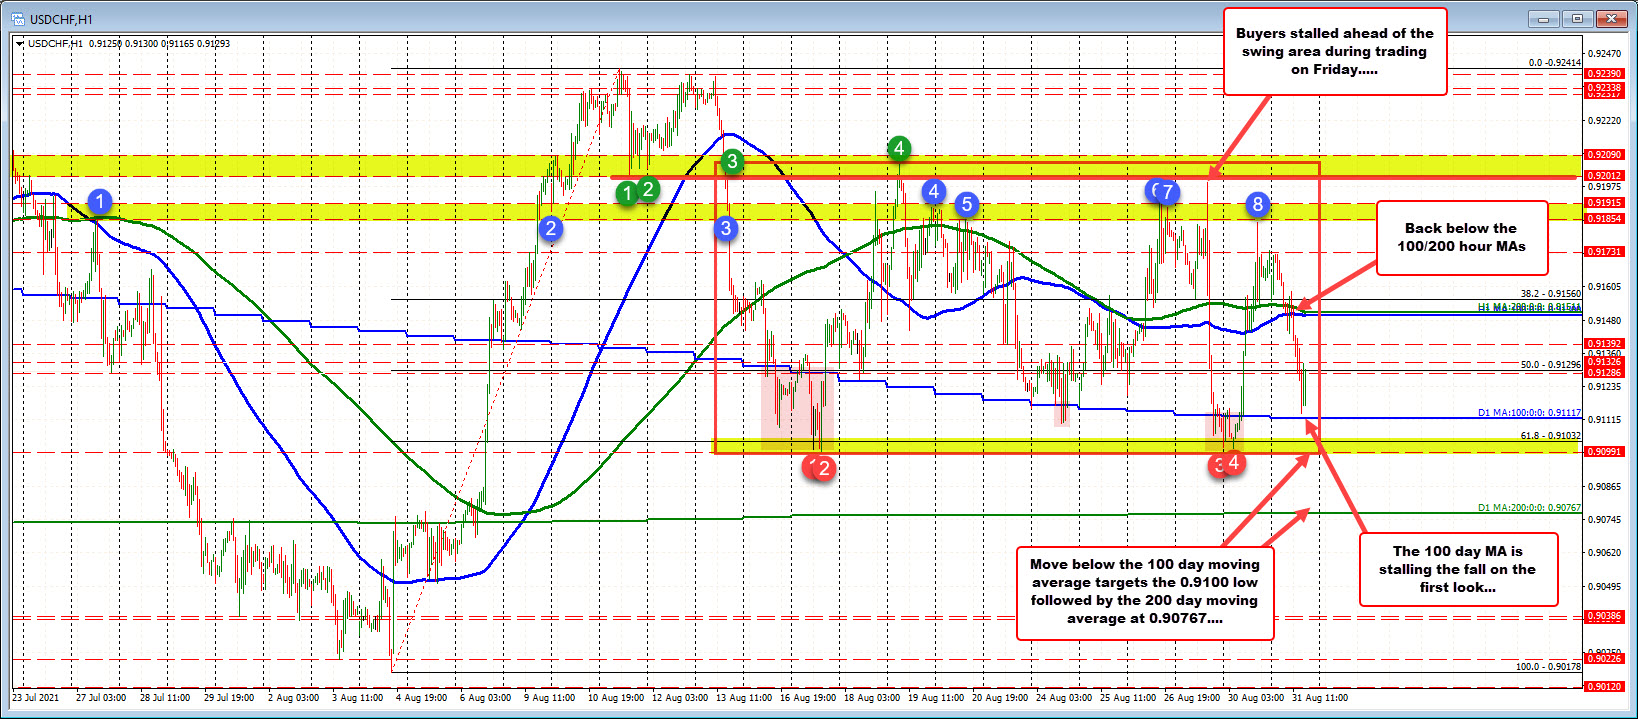
Today, the price action opened above those MAs, but started to weaken back toward the levels in the European morning session. After trading above and below the level for a few hours, traders started to increase the downside momentum.
The move to the downside (away from the moving averages), saw the price fall back below the 50% midpoint of the August trading range at 0.91296. That break had traders looking toward the next key target at the 100 day moving average at 0.91117.
The USDCHF has seen the price move below that key 100 day moving average back on August 15, August 16, August 24 and again on Friday and yesterday. Each break ultimately failed with the price moving back higher fairly aggressively (including yesterday's run to the upside).
Today, the buyers leaned ahead of the 100 day moving average level, and pushed the price back toward the 50% midpoint level at 0.91296. The current price trade at 0.9125.
What now?
Get and stay above the 50% midpoint, and the dip buyers against the 100 day moving average start to feel little bit more comfortable. A move back toward the 100/200 hour moving averages cannot be ruled out.
Conversely, if sellers can lean against the 50% midpoint level, another run below the 100 day moving average would be eyed. Get below the swing lows from August 17, and yesterday's low near the 0.9100 level would, should increase the bearish bias with the 200 day moving average at 0.90767 as the next key target.

