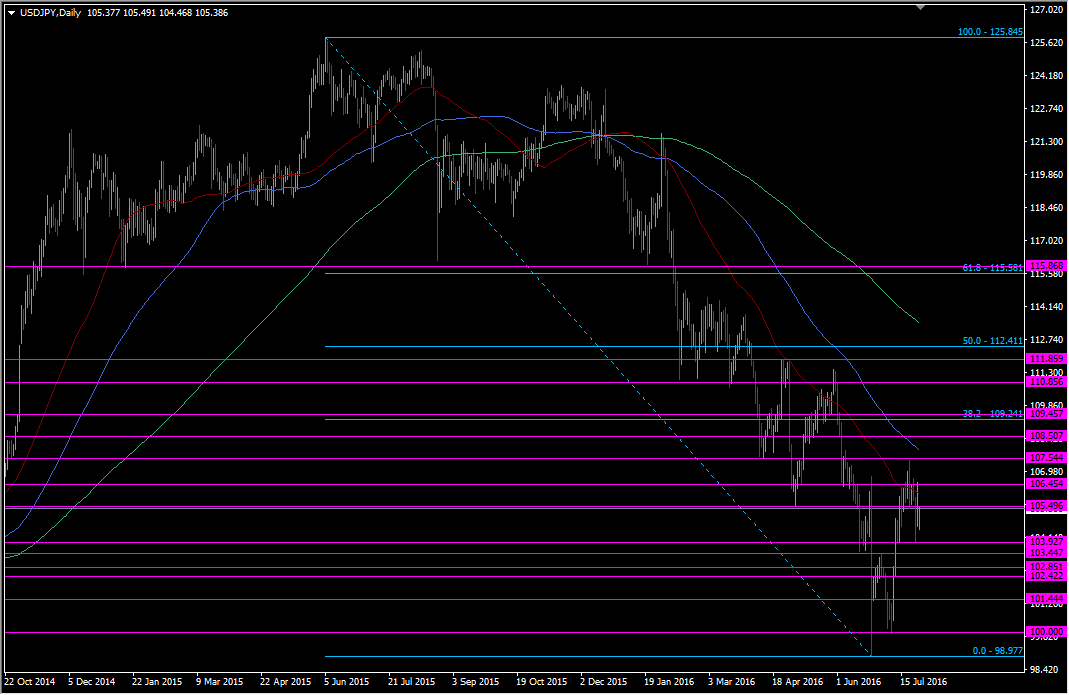
Time to gaze over the charts to see what levels might come into focus
This event is very much different to planning for a data point. There's a huge range of possibilities with this one. For something like the NFP you can pretty much pick levels within 100-150 pip range either side and be more or less certain the price will be contained within it.
This event has been hyped into something big and that's going to be reflected in the moves we're going to see. I can't really see any scenario where the price does nothing but flap around in 100+ pip clips. Nevertheless, if the price stops somewhere it's almost certain it will stop for a reason, and that's usually a technical level.
I've taken a fresh look at the charts and concentrated on what I believe will be the strongest levels.
Up
We've got various levels here, 106.00, 106.45/50, 106.80 & 107.00. I reckon all these are too close to have any influence over the announcement. Don't discount them entirely as they may mean something if the price moves away but comes back sometime after
107.54 is perhaps the nearest level that may put the brakes on or slow any move
107.90 is the 100 dma and will be in the mix with the big figure at 108.00
108.50/70 is a sticky looking area before 109.00
109.24 is the 38.2 fib of the 125 highs
109.45/50 comes after thatm, and we're likely to see some resistance ahead of 110.00 around 109.80/90
110.00 is a big fat round number and one that will always have traffic around it
A break of that and we'll be looking at the usual 50's (110.50) and the 80/85's (110.80/85) through here and 111.
112.41 is the 50.0 fib of the 125 highs
Down
104.50, 104.00 can probably be ignored.
103.45/50 might contain action that mildly disappoints
103.00 will have some big figure protection
102.80/85 comes next, ahead of 102.40/45
102.10/15 will offer some support ahead of 102.00
Another minor looking level at 101.75 comes next ahead of a stronger looking 101.40/50
Minor support at 101.10/15 fronts the big figure
Below 101 we'll have 100.50 as the strongest point before we take a shot at 100.00
Break that and we'll be looking at the Brexit lows

USDJPY daily chart
These are just levels I'm expecting the price to ask a question at. They may hold, they may break but they can offer you a place to either get in if they break or get out if the price struggles there. Lean against them and use them to define your risk, if you want to trade through this.
Good luck all.


