
Where could it go?
The S&P is looking like it might close higher today, but the move since the last peak did take the stock market down about 3.31%.
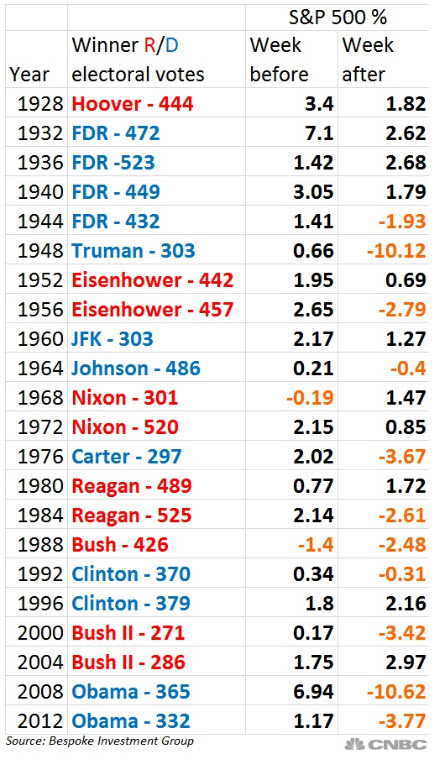
Looking at the history of the moves a weak before the election, Bespoke Investment Group has put together a list of the moves before and after the election.
According to their data, the last 6 elections had gains with the low being a 0.34 gain (Bill Clinton's first term in 1992), and the largest being a 6.94% gain (Obama's first term in 2008). Going back further, there has only been 2 times out of 22, when the stock market has not rallied the final week into an election.
If the close on Monday (October 31) is the start point of the week before this election, the S&P index closed at 2126.15 on that day. It is currently trading at 2097. So it is down about -1.25%. There is still today and Monday for the market to snatch victory from the jaws of defeat and end positive but as of now, this year would be the 3rd time in 23 elections.
What has happened the week AFTER the election. Again according to Bespoke, the reaction recently has been to the downside. They say that there have been only 3 times in the last 10 elections where the S&P index was up a week after the election. The largest gain was 2.97% after Bush II's second term victory in 2004. The largest decline was after Obama's first term election. In that year, the S&P fell -10.62%.. The average of the 7 declines comes out to -3.84%.
I heard a report this morning that Citibank is expecting a 5% decline on a Trump victory. Judging from the most recent reactions, a decline is not out of the question. The market seems to be most concerned when Trump polls are doing better. So the direction seems about right as does the magnitude (5% might be too low given an average decline of 3.84%).
Assume 5% is what we have to look forward to on a Trump victory (heck it might be the same for Clinton as well), what will a 5% decline look like in the S&P?

Looking at the S&P chart above, a 5% decline would take the price down toward the post Brexit low at the 1991 level (from current levels). That seems like a logical and perhaps ironic place to bottom. Brexit was a shock and a Trump victory would be a shock too. I don't think that is too far out of the question given the initial reaction. What do you think?
What if the market does not really like the idea of Trump at all, and instead of a 5% decline, it has an Obama like 10% decline? A 10% move would take the S&P down to the February 24th low at 1891. From the years high, that would imply a -13.75% decline from the peak. From the end of 2015 year close, it would imply an S&P decline for 2016 of -7.50%.. Last year the S&P was close to unchanged, but it was down -0.73% on the year. A decline would be first back to back since 2002 (it actually fell three years in a row by -10%, -13% and -23%. Yikes)
Is that type of decline possible? Has the world ever experienced a US president like Donald Trump? Not really. But you gotta think that those that love him, expect him to "Make America Great Again". So they should temper the fall. In which case the 5% level might be a good place to stall. On the other hand, if the global investors start unload "just because" and market's overshoot, maybe 1900 might be a stretch but 1950ish might be a compromise.
PS. The low today tested the 200 day MA and held. So that is actually a bullish sign - at least for now.

