The AUDUSD has dipped (higher dollar) after the better-than-expected ISM nonmanufacturing data. Recall Fed's Waller put a disclaimer on his view for interest rates saying that if the economic data remains hot, he would favor higher rates. This nonmanufacturing index remains hot. The prices paid - although lower than last month - remained elevated at 65.6. New orders and employment also rose.
Th US 10 year yield dipped back below the 4% level briefly before the release, but is now trading at 4.02%. That is still down -5.5 basis points but off the lows. The two-year note is trading around 4.90% near unchanged on the day
Looking at the hourly chart, the AUDUSD has moved back below its 100 hour and 100 day moving averages. Both of them are near the 0.6743 level. The current price trades at 0.6736. If the price can remain below those moving averages, it would build the bias to the downside
This week the price has been trading above and below the 100 day moving average as traders ponder risk-on or risk-off. The high price was reached on Wednesday at 0.67842. The low price was also on Wednesday at 0.6694. At the high, it tested the swing low from February 23. That level was broken on February 24 and the market scooted lower. The high price today stalled ahead of the 200 hour moving average.
Looking back in time the price has not traded above the 200 hour moving average since February 15. On February 16, February 20 and 21st, the price tested the 200 hour moving average only to find willing sellers. Going forward it would take a move back above that moving average to give the buyers some hope and control. The moving average currently comes in at 0.67712. Above it is the 200 day moving average at 0.67927. The high price on Wednesday fell short of that target.
All of which keeps the sellers in control.
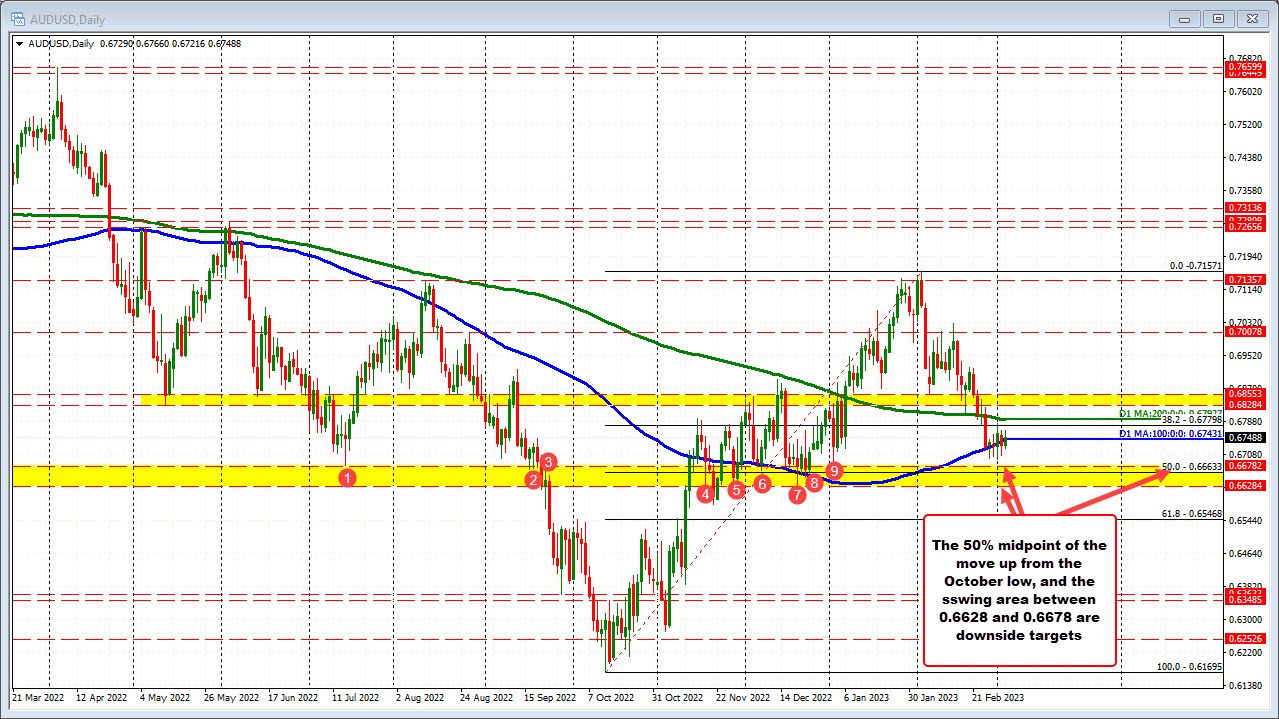
On the downside the lows for the week just below the 0.6700 level will need to be broken to open the downside for further selling. On the downside, the 0.6628 to 0.6678 area on the daily chart below, is the next target area (see red numbered circles on the chart below). The 50% midpoint of the move up from the October low is within that area at 0.66633.