The strongest to weakest of the major currencies
The JPY is the strongest while the GBPUSD is weakest as the North American session begins. The USD is back to being stronger after 3 days of declines. IN the UK the inflation data came out and its highest level in 40 years. Although keeps pressure on the Bank of England to continue to hike rates, traders don't like the implications to the growth prospects. Meanwhile Brexit concerns resurfaced as the UK intends to stop checking goods going between mainland Britain and Northern Ireland.
Crude oil futures are higher after a decline yesterday. The private inventory data showed a surprise drawdown of inventories (were expected a rise in inventories). The national average of gasoline prices reached $4.56 yesterday
Stocks are lower after the solid gains yesterday. Target and Lowes announced weaker earnings this morning which is helping to weigh on the major indices. Target shares are down close to 25%. They cite decreasing margins as a result of higher prices. However they do say that consumer demand remains strong (but will it remain strong if prices are increased?).
There has been large blocks sales going through US debt market. Yields are higher across the curve. Gold is following the whims of the US dollar. With the dollar higher, gold prices are lower
A look around the markets is showing:
Spot gold is down -$5.59 -0.31% at $1808.78 Silver is down $0.03 -0.18% at $21.57 WTI crude oil
Crude Oil
Crude oil is the most popular tradable instrument in the energy sector, offering exposure to global market conditions, geopolitical risk, and economics. The instrument is strategically relied upon and situated in the global economy. Crude oil has proven to be a unique option for traders given volatility and the efficacy of both swing trading and longer-term strategies. Despite its popularity, crude oil is a very complex investing instrument, given the litany of fluctuations in oil prices, risk, and impact of politics stemming from OPEC. Short for the Organization of the Petroleum Exporting Countries, OPEC operates as an intergovernmental organization of 13 countries, helping set and dictate the global oil market.How to Trade Crude Oil Crude oil is most commonly traded as an exchange-traded fund (ETF) or through other instruments with exposure to it. This includes energy stocks, the USD/CAD, and other investing options. Crude oil itself is traded across a duality of markets, including the West Texas Intermediate Crude (WTI) and Brent crude. Brent is the more relied upon index in recent years, while WTI is more heavily traded across futures trading at the time of writing. Other than geopolitical events or decisions by OPEC, crude oil can move due to a variety of different ways. The most basic is through simple supply and demand, which is affected by global output. Increased industrial output, economic prosperity, and other factors all play a role in crude prices. By extension, recessions, lockdowns, or other stifling factors can also influence crude prices. For example, an oversupply or mitigated demand due to the aforementioned factors would result in lower crude prices. This is due to traders selling crude oil futures or other instruments. Should demand rise or production plateau, traders will bid increasingly on crude, whereby driving prices up.
Read this Term is trading at $115.12 up 2.5%.. Fuel prices are up 70% year-over-year Bitcoin is trading back below the $30,000 level at $29,860.53 In the premarket for US stocks, the major indices are trading lower as concerns about inflation and impact on earnings weighs on the indices
Dow industrial average down 180 points after yesterdays 431.17 point rise S&P index down 29.55 points after yesterdays 80.82 point rise NASDAQ down 136 points after yesterdays 321.73 point rise In the European equity markets, the major indices
Indices
Stock market indices represents an index that measures a particular stock market or a segment of the stock market. These instruments are important investors as they help compare current price levels with past prices to calculate market performance.The main two parameters for indices are that they are both investable and transparent. For example, investors can invest in a stock market index by buying an index fund, which is structured as either a mutual fund or an exchange-traded fund, and track an index. The difference between an index fund's performance and the index, if any, is called tracking error. Most major countries boast multiple indices. Commonly traded indices include the S&P 500, NASDAQ-100, Dow Jones Industrial Average (DIJA), EURO STOXX 50, Hang Seng Index, and many more.Stock market indices can be characterized or segmented by the index coverage set of stocks. The overall coverage of an index constitutes an underlying group of stocks, most commonly grouped together by underlying investor demand.How to Trade IndicesRetail brokers offer indices exposure through the use of contracts-for-difference (CFDs) or exchange-traded funds (ETFs). Each are popular ways to trade specific markets and are almost always on offer at most brokers.Investors can choose between multiple types of indices that traditionally fall within several categories. This includes country coverage, regional coverage, global coverage, exchange-based coverage, and sector-based coverage.All indices are ultimately weighted in a number of different ways. The most common mechanisms include market-capitalization weighting, free-float adjusted market capitalization weighting, volatility weighting, price weighting, and others.
Read this Term are trading mostly lower
German Dax -0.2% France's CAC -0.25% UK's FTSE 100 -0.25% Spain's Ibex +0.3% Italy's FTSE MIB unchanged 
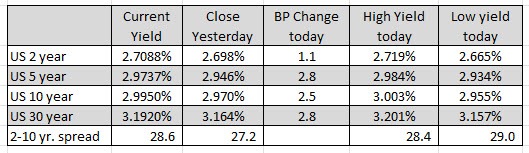
In the US debt market, yields are up about 3 basis points. A huge block of treasury sales reportedly a European fund that is lowering duration is responsible.
US yields are higher
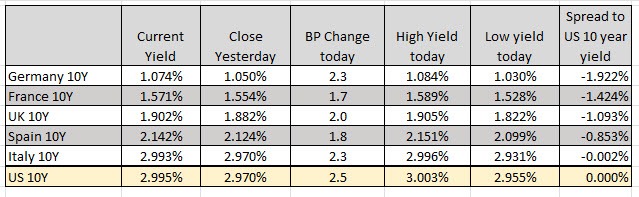
The European debt market, the yields are also higher across the board:
European yields are higher across the board
ADVERTISEMENT - CONTINUE READING BELOW